Vallebona Weather & Climate: Best Time to Visit
Temperatures in Vallebona, Italy, vary greatly throughout the year. August is the hottest month at 25°C (77°F), while February is the coldest at 11°C (52°F).
With around 893 mm (35 in) of annual rainfall, the city has moderate precipitation levels. November is the wettest month and August the driest. It also has a distinct dry season from July to August. July is the sunniest month, averaging 11.4 hours of sunshine per day.
Monthly Temperature in Vallebona
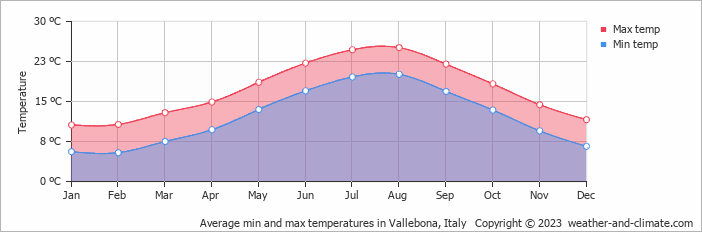
The climate in Vallebona is known for significant temperature differences throughout the year, making the weather dynamic. Typically, average maximum daytime temperatures range from a comfortable 25°C (77°F) in August to a chilly 11°C (52°F) in the coolest month, February.
Nights vary from 20°C (68°F) in August to around 5°C (41°F) during the colder months.Check out our detailed temperature page for more information.
Temperature ranges by month
Rainfall in Vallebona
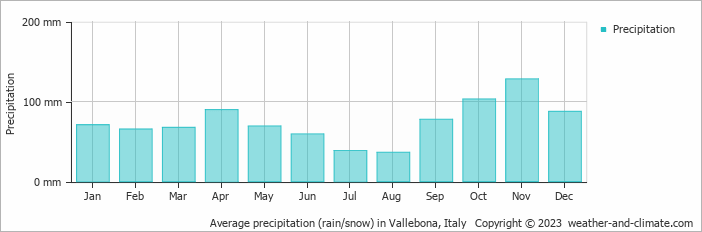
Generally, Vallebona receives mid-range precipitation levels, with 893 mm (35 in) annually. The climate in Vallebona shows significant variation throughout the year. Expect high rainfall in November, the wettest month, with an average of 128 mm (5 in) of precipitation over 10 rainy days.
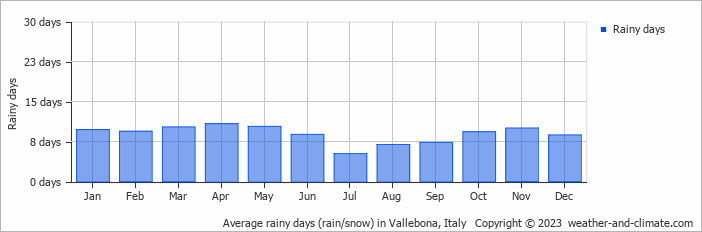
In contrast, the driest month August offers drier and sunnier days, with around 36 mm (1.4 in) of rainfall over 7 rainy days. For more details, please visit our Vallebona Precipitation page.The mean monthly precipitation over the year, including rain, hail, and snow
The average number of days each month with precipitation
Sunshine Hours in Vallebona
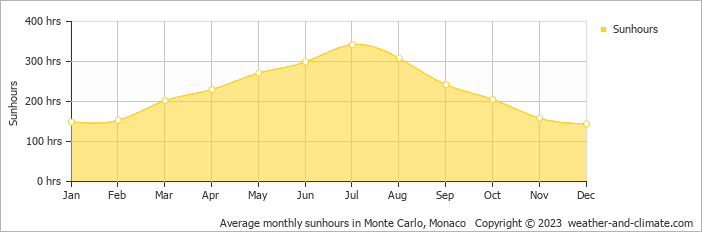
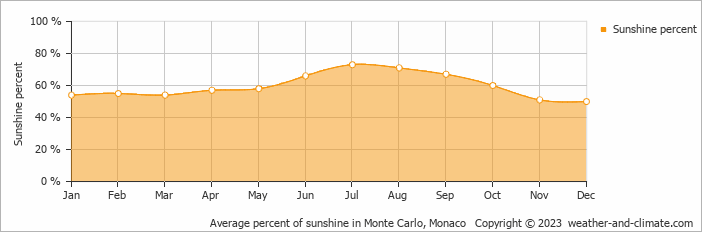
For those who appreciate different seasons, Vallebona serves as an ideal destination. Expect longer, more sun-filled days in July with an average of 11.4 hours of sunshine daily, and embrace the darker days in December, offering only 4.8 hours of daily sunlight.
Visit our detailed sunshine hours page for more information.
Monthly hours of sunshine
Daily hours of sunshine
Daily percentage of sunshine
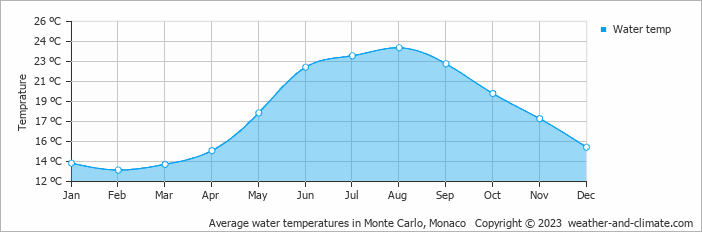
Water Temperature in Vallebona
The mean water temperature over the year ranges from 13°C (55°F) in February to 24°C (75°F) in August.
Water temperature over the year
Vallebona 3-Day Forecast
Check the conditions for any month of the year.


