Vallarga Weather & Climate: Best Time to Visit
Vallarga, Italy, sees big temperature differences between seasons, with July peaking at 20°C (68°F) and January dropping to -2°C (28°F).
With around 1187 mm (47 in) of annual rain/snowfall, Vallarga has a notably wet climate. The wettest month is June. The sunniest month is May, with 6.2 hours of sunshine per day on average.
Monthly Temperature in Vallarga
Visitors to Vallarga can expect significant temperature changes throughout the year. Average daytime temperatures reach a pleasant 20°C (68°F) in July. In January, the coolest month of the year, temperatures drop to a very cold -2°C (28°F).
At night, temperatures range from around 8°C (46°F) in July to -11°C (12°F) in January.Check out our detailed temperature page for more information.
Temperature ranges by month

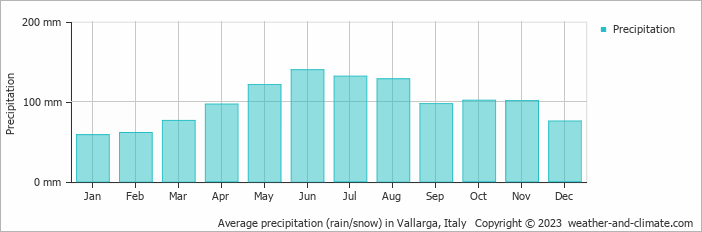
Rainfall in Vallarga
Vallarga is known for its substantial rain/snowfall, with annual precipitation reaching 1187 mm (47 in). Vallarga can be quite wet during June, receiving approximately 140 mm (5.5 in) of precipitation over 19 rainy days.
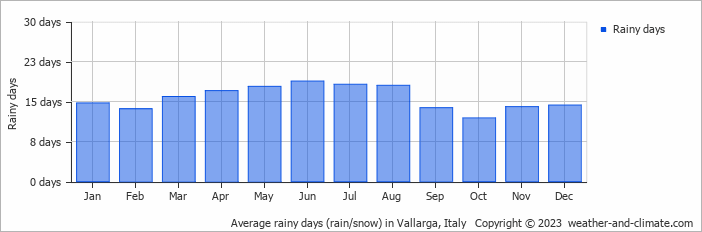
In contrast, during the driest month (January), you will experience much drier conditions, with 58 mm (2.3 in) of precipitation spread across 15 snowy days days. For more details, please visit our Vallarga Precipitation page.The mean monthly precipitation over the year, including rain, hail, and snow
The average number of days each month with precipitation
Sunshine Hours in Vallarga
Vallarga can be enjoyed more throughout the sunniest month of May under a blue sky, with approximately 6.2 hours of sunshine daily. In contrast, the city experiences much darker days in January, with only 0.1 hours of sunlight per day.
Visit our detailed sunshine hours page for more information.
Monthly hours of sunshine
Daily hours of sunshine
Humidity in Vallarga by Month
The relative humidity is high throughout the year in Vallarga.
The city experiences its highest humidity in December, reaching 84%. In May, the humidity drops to its lowest level at 46%. What does this mean? Read our detailed page on humidity levels for further details.
Relative humidity over the year

Vallarga 3-Day Forecast
Check the conditions for any month of the year.
Best Time to Visit Vallarga
During June, July and August, Vallarga experiences its most favorable weather, with temperatures between 17°C (63°F) and 20°C (67°F). These mild conditions make it an excellent time for a visit.The weather does bring rainfall during this period, between 128 mm (5 in) and 140 mm (5.5 in). Planning your next adventure but unsure where to go? Our climate tool suggests perfect locations tailored to your preferred weather conditions. Discover your ideal travel destination with our weather planner.


