Rosario Weather & Climate: Best Time to Visit
Average temperatures, rainfall, sunshine and the best time to visit Rosario.
Climate overview of Rosario
Rosario, Colonia, Uruguay, sees big temperature differences between seasons, with January peaking at 30°C (86°F) and July dropping to 16°C (61°F).
The city has a wet climate, receiving around 1141 mm (45 in) of rainfall per year. February is the wettest month.
Rosario Weather by Month
Pick a month to see the average temperature, rainfall and sunshine in Rosario — and find the best time to visit.
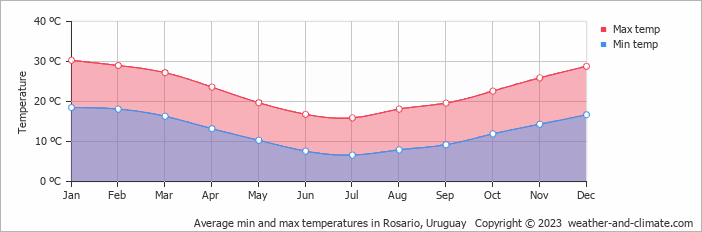
Monthly Temperature in Rosario
Visitors to Rosario can expect significant temperature changes throughout the year. On average, daytime temperatures range from a very warm 30°C (86°F) in January to a moderate 16°C (61°F) in July.
Nighttime temperatures range from 19°C (66°F) in January to 7°C (45°F) in July.
Check out our detailed temperature page for more information.
Temperature ranges by month
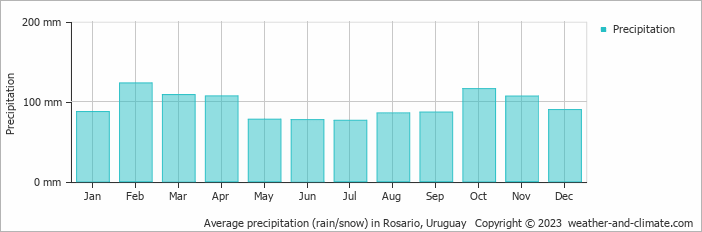
Rainfall in Rosario
Rosario is known for its substantial rainfall, with annual precipitation reaching 1141 mm (45 in). The wettest period in Rosario occurs in February, which receives around 123 mm (4.8 in) of precipitation. During the driest month, July, Rosario experiences moderate rainfall, totaling 76 mm (3 in). The consistent precipitation levels throughout the year contribute to a relatively stable climate. For more details, please visit our Rosario Precipitation page.
The mean monthly precipitation over the year, including rain, hail, and snow
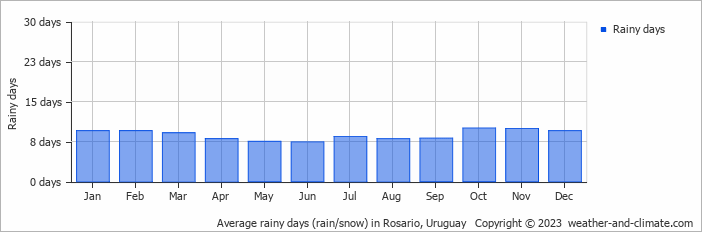
The average number of days each month with precipitation
Best Time to Visit Rosario
The weather does bring rainfall during this period, between 78 mm (3.1 in) and 116 mm (4.6 in). Looking for inspiration on where to travel this year? We have a tool that recommends destinations based on your ideal conditions. Find out where to go with our weather planner.
Frequently asked questions about the climate in Rosario
What is the best time to visit Rosario?
May, September and December typically offer the most optimal weather in Rosario. In contrast, January, June and July tend to have less optimal conditions.
What temperatures can I expect in Rosario?
Daytime highs range from 16°C (61°F) in July to 30°C (86°F) in January. Nighttime lows range from 7°C (45°F) to 19°C (66°F). Temperatures vary considerably through the year.
How much rain does Rosario get?
Annual rainfall is around 1141 mm (45 in). February is the wettest month with 123 mm (4.8 in), while July is the driest with 76 mm (3 in).
Rosario 3-Day Forecast
Rosario 3-Day Forecast
Rosario on the map
Rosario is highlighted — select any city to see its climate.
Popular this month
Where to go in July — average daytime high across popular destinations.
Bucket list
Need travel inspiration? Check out our bucket list articles and be inspired.
 The 10 most alternative cities in South America
Discover South America's top 10 alternative cities! From Valparaíso's vibrant streets to La Paz's high-altitude charm and Medellín's innovative spirit.
 Carmelo is the best kept secret of Uruguay
With its natural beauty and history, Carmelo is an inviting place to visit. Enjoy nature, tranquility, authenticity, the 'wine' and activities such as cycling, walking and horse riding.