Ravangla Weather & Climate: Best Time to Visit
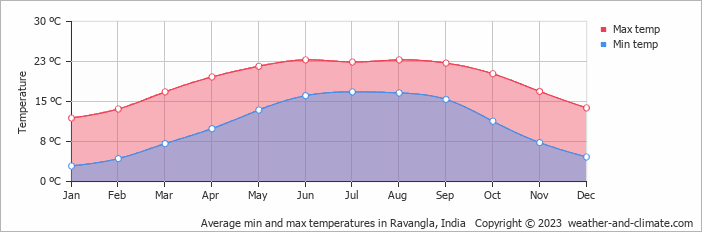
Ravangla, India, experiences moderate temperature changes through the seasons. June is the warmest month with daytime highs of 23°C (73°F), while January is the coolest at 12°C (54°F).
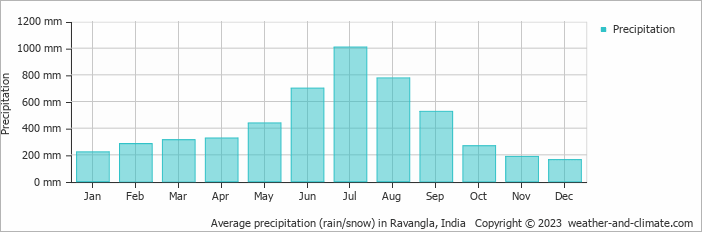
Rain/snowfall is high, totalling around 5201 mm (205 in) per year. July is the wettest month and December the driest.
Monthly Temperature in Ravangla
The weather in Ravangla changes moderately throughout the year, offering enough variation to appreciate each season. Average maximum daytime temperatures range from a comfortable 23°C (73°F) in June, the warmest time of the year, to a chilly 12°C (54°F) during cooler months like January.
At night, you can expect temperatures ranging from 17°C (63°F) in June to around 3°C (37°F) during January.
Check out our detailed temperature page for more information.
Temperature ranges by month
Rainfall in Ravangla
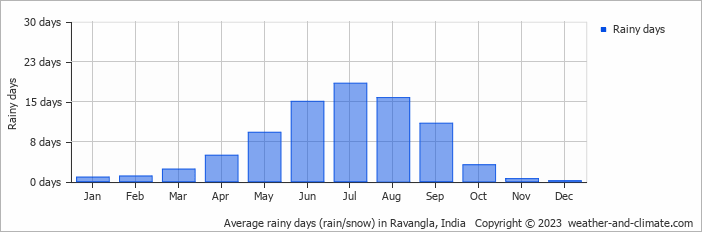
Ravangla has a relatively rain/snowy climate with high precipitation levels, averaging 5201 mm (205 in) of rain/snowfall annually. Significant seasonal changes in precipitation occur throughout the year. In the wettest month, July it receives heavy rainfall, averaging 1007 mm (40 in) of precipitation, recorded across 18 rainy days. In contrast, the driest month December brings less rainfall, with 162 mm (6.4 in) over 0 rainy days. For more details, please visit our Ravangla Precipitation page.
The mean monthly precipitation over the year, including rain, hail, and snow
The average number of days each month with precipitation
Humidity in Ravangla by Month
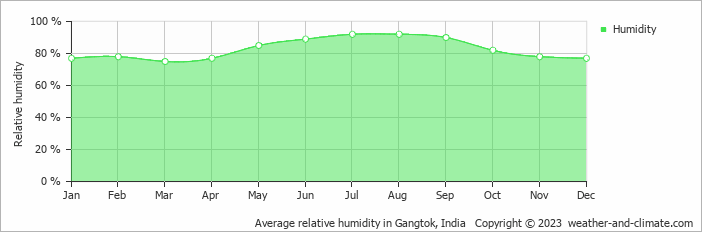
The city experiences its highest humidity in July, reaching 92%. In March, the humidity drops to its lowest level at 75%. What does this mean? Read our detailed page on humidity levels for further details.
Relative humidity over the year
Ravangla 3-Day Forecast
Check the conditions for any month of the year.
Best Time to Visit Ravangla
Ravangla experiences heavy rainfall throughout the year, with no distinct dry season. All months receive significant precipitation above 160 mm (6.3 in), making it a consistently wet climate. If we needed to point out one month as a best month to visit, it would be October, the driest month with 267 mm (11 in) of rainfall.Pack waterproof clothing and plan some indoor activities, as rain is expected year-round. The consistent rainfall creates green landscapes, but requires preparation for wet conditions. Need help choosing your next travel destination? We offer a specialized tool that matches you with locations based on your weather preferences. Explore destinations that suit your climate preferences.


