Ponta da Tulha Weather & Climate: Best Time to Visit
Average temperatures, rainfall, sunshine and the best time to visit Ponta da Tulha.
Climate overview of Ponta da Tulha
With consistently stable weather, Ponta da Tulha, Bahia, Brazil, sees little seasonal temperature change. Daytime highs average 28°C (82°F), ranging from 30°C (86°F) in February to 26°C (79°F) in August.
With around 1362 mm (54 in) of annual rainfall, Ponta da Tulha has a notably wet climate. The wettest month is April. The sunniest month is March, with 7.8 hours of sunshine per day on average.
Ponta da Tulha Weather by Month
Pick a month to see the average temperature, rainfall and sunshine in Ponta da Tulha — and find the best time to visit.
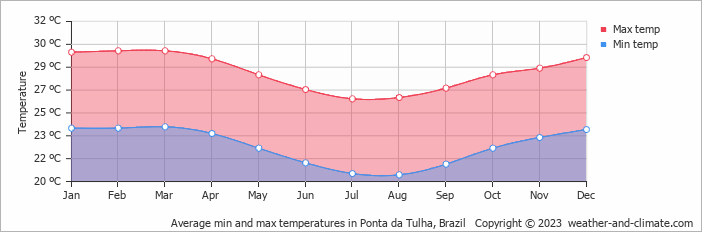
Monthly Temperature in Ponta da Tulha
The climate in Ponta da Tulha remains fairly constant, offering comfortable temperatures throughout the year. Average daytime temperatures reach a comfortable 30°C (86°F) in February. In August, the coolest month of the year, temperatures drop to a comfortable 26°C (79°F).
At night, temperatures range from around 24°C (75°F) in February to 21°C (70°F) in August.
Check out our detailed temperature page for more information.
Temperature ranges by month
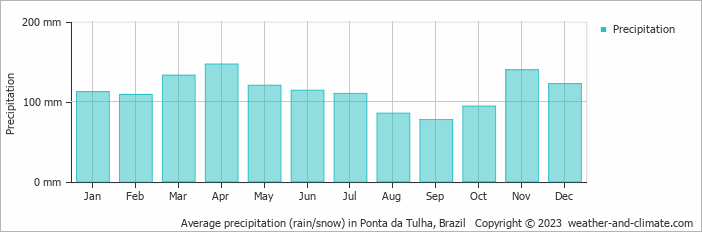
Rainfall in Ponta da Tulha
Ponta da Tulha is known for its substantial rainfall, with annual precipitation reaching 1362 mm (54 in). Ponta da Tulha experiences moderate seasonal variation in rainfall, with monthly averages ranging from 147 mm (5.8 in) in April, the wettest month, and 77 mm (3 in) in September, the driest month. For more details, please visit our Ponta da Tulha Precipitation page.
The mean monthly precipitation over the year, including rain, hail, and snow
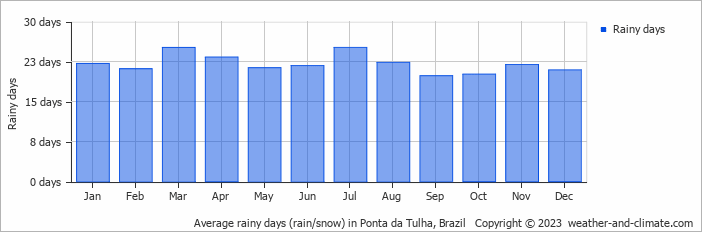
The average number of days each month with precipitation
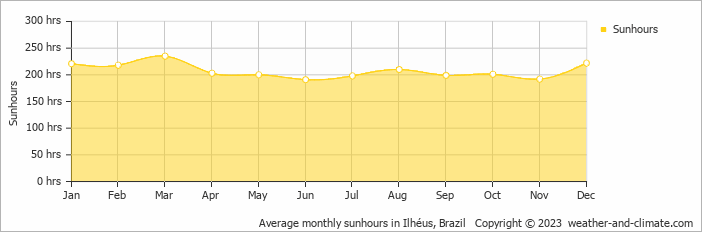
Sunshine Hours in Ponta da Tulha
Despite minor fluctuations, Ponta da Tulha enjoys a fairly consistent amount of sunshine throughout the year. In March, you can expect approximately 7.8 hours of daily sunshine, while even in June, Ponta da Tulha still receives about 6.4 hours.
Visit our detailed sunshine hours page for more information.
Monthly hours of sunshine
Daily hours of sunshine
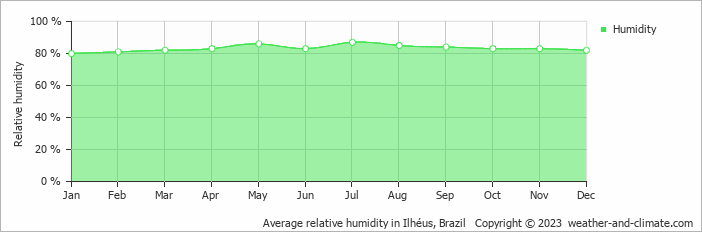
Humidity in Ponta da Tulha by Month
The city experiences its highest humidity in July, reaching 87%. In January, the humidity drops to its lowest level at 80%. What does this mean? Read our detailed page on humidity levels for further details.
Relative humidity over the year
Best Time to Visit Ponta da Tulha
Make your experience more enjoyable by planning to be outside during the cooler parts of the day, either early morning or as the sun begins to set. Wondering where to travel based on your weather preferences? Our recommendation tool helps you find destinations with your ideal climate conditions. Use our weather planner to find your perfect destination.
Frequently asked questions about the climate in Ponta da Tulha
What is the best time to visit Ponta da Tulha?
August, September and October typically offer the most optimal weather in Ponta da Tulha. In contrast, January, February and March tend to have less optimal conditions.
What temperatures can I expect in Ponta da Tulha?
Daytime highs range from 26°C (79°F) in August to 30°C (86°F) in February. Nighttime lows range from 21°C (70°F) to 24°C (75°F). Temperatures stay relatively stable year-round.
How much rain does Ponta da Tulha get?
Annual rainfall is around 1362 mm (54 in). April is the wettest month with 147 mm (5.8 in), while September is the driest with 77 mm (3 in).
How sunny is Ponta da Tulha?
Ponta da Tulha receives around 2,490 hours of sunshine per year. March is the sunniest month with 235 hours, while June is the cloudiest with just 191 hours. Overall, Ponta da Tulha enjoys abundant sunshine.
Ponta da Tulha 3-Day Forecast
Ponta da Tulha 3-Day Forecast
Ponta da Tulha on the map
Ponta da Tulha is highlighted — select any city to see its climate.
Popular this month
Where to go in July — average daytime high across popular destinations.
Bucket list
Need travel inspiration? Check out our bucket list articles and be inspired.
 The 10 most alternative cities in South America
Discover South America's top 10 alternative cities! From Valparaíso's vibrant streets to La Paz's high-altitude charm and Medellín's innovative spirit.
 The 5 most tranquil retreats in the Amazon Rainforest, Brazil
Discover top sustainable lodges in the Amazon. Enjoy unique wildlife, eco-friendly stays, and immersive experiences at Anavilhanas, Cristalino, and more.
An alternative way to discover Rio de Janeiro
Don't feel like seeing the traditional tourist sights in Rio de Janeiro? We have made an overview of the sights in Rio de Janeiro that you must see if you want to visit Rio in an alternative way.
Iguazu Falls
Iguazu Falls are among the largest waterfalls on earth. You will be speechless when you see this miracle of mother nature. They are included in the World Heritage List and have also been named one of the seven wonders of the world.