Quảng Trị Weather & Climate: Best Time to Visit
Average temperatures, rainfall, sunshine and the best time to visit Quảng Trị.
Climate overview of Quảng Trị
The climate in Quảng Trị, Quang Tri, Vietnam, sees a moderate range of temperatures across the year, from 35°C (95°F) in June down to 24°C (75°F) in January.
Rainfall is high, totalling around 2437 mm (96 in) per year. October is the wettest month and June the driest. The city also experiences a distinct rainy season from September to December. May is the sunniest month, averaging 8.5 hours of sunshine per day.
Quảng Trị Weather by Month
Pick a month to see the average temperature, rainfall and sunshine in Quảng Trị — and find the best time to visit.
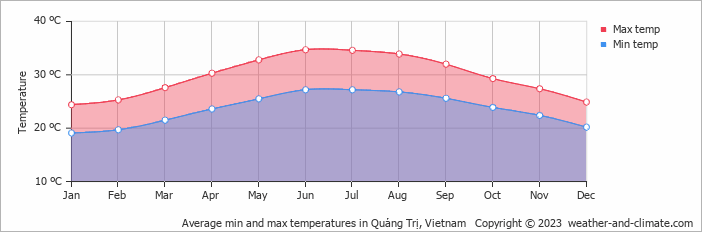
Monthly Temperature in Quảng Trị
In Quảng Trị, seasonal changes bring about a moderate variation in temperatures. Average maximum daytime temperatures range from a very warm 35°C (95°F) in June, the warmest time of the year, to a comfortable 24°C (75°F) during cooler months like January.
At night, you can expect temperatures ranging from 27°C (81°F) in June to around 19°C (66°F) during January.
Check out our detailed temperature page for more information.
Temperature ranges by month
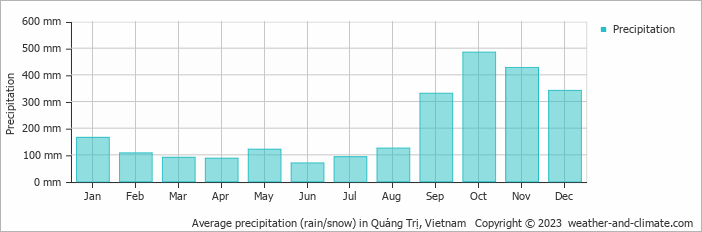
Rainfall in Quảng Trị
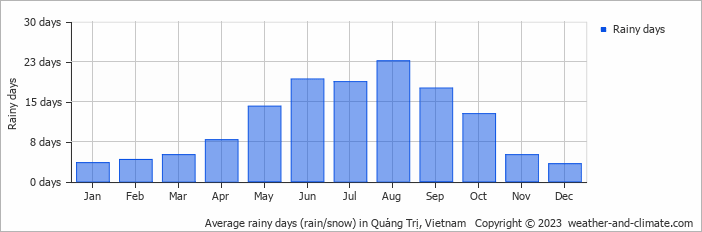
Quảng Trị experiences significant rainfall throughout the year, averaging 2437 mm (96 in) of precipitation annually. Significant seasonal changes in precipitation occur throughout the year. In the wettest month, October it receives heavy rainfall, averaging 484 mm (19 in) of precipitation, recorded across 13 rainy days. In contrast, the driest month June brings less rainfall, with 69 mm (2.7 in) over 19 rainy days. For more details, please visit our Quảng Trị Precipitation page.
The mean monthly precipitation over the year, including rain, hail, and snow
The average number of days each month with precipitation
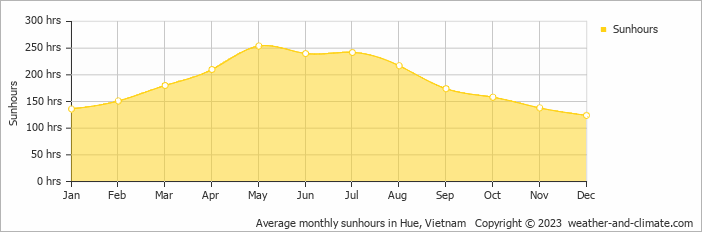
Sunshine Hours in Quảng Trị
Seasonal changes in sunshine hours are quite dramatic in Quảng Trị. While May receives considerable daily sunshine with up to 8.5 hours, December marks the darkest time of the year, where sunshine is scarce with only 4.1 hours of sunlight per day.
Visit our detailed sunshine hours page for more information.
Monthly hours of sunshine
Daily hours of sunshine
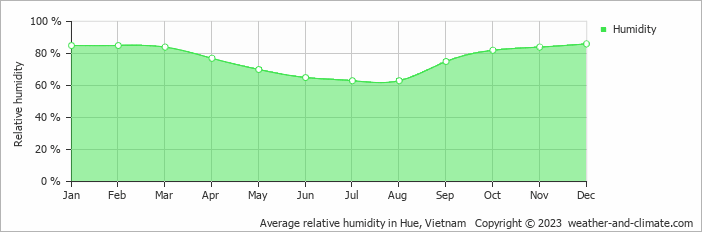
Humidity in Quảng Trị by Month
The relative humidity is high throughout the year in Quảng Trị.
The city experiences its highest humidity in December, reaching 86%. In July, the humidity drops to its lowest level at 63%. What does this mean? Read our detailed page on humidity levels for further details.
Relative humidity over the year
Best Time to Visit Quảng Trị
Be prepared for heavier rainfall during January, September, October, November and December, the wettest period of the year. Seeking the perfect travel destination for this year? We've created a tool that suggests locations matching your desired weather. Let our weather planner guide your travel decisions.
Frequently asked questions about the climate in Quảng Trị
What is the best time to visit Quảng Trị?
March typically offers the most optimal weather in Quảng Trị. In contrast, May, June, July, August, September, October, November and December tend to have less optimal conditions. Quảng Trị has a distinct rainy season from September to December.
What temperatures can I expect in Quảng Trị?
Daytime highs range from 24°C (75°F) in January to 35°C (95°F) in June. Nighttime lows range from 19°C (66°F) to 27°C (81°F).
How much rain does Quảng Trị get?
Annual rainfall is around 2437 mm (96 in). October is the wettest month with 484 mm (19 in), while June is the driest with 69 mm (2.7 in).
How sunny is Quảng Trị?
Quảng Trị receives around 2,224 hours of sunshine per year. May is the sunniest month with 254 hours, while December is the cloudiest with just 124 hours. Overall, Quảng Trị enjoys abundant sunshine.
Quảng Trị 3-Day Forecast
Quảng Trị 3-Day Forecast
Quảng Trị on the map
Quảng Trị is highlighted — select any city to see its climate.
Popular this month
Where to go in July — average daytime high across popular destinations.
Bucket list
Need travel inspiration? Check out our bucket list articles and be inspired.
 Visit Sapa in Vietnam
Balancing on the edges of a rice field with endless views. A trek through the valley of Sapa is definitely a must for the bucket list.
Peace, beauty and silence in Vietnam
Vedana is located along the shores of a secluded, peaceful and serene lagoon, surrounded in lushly forested peaks. This ensures an isolated appeal and stunning views across a vast immense lagoon.