Muriú Weather & Climate: Best Time to Visit
Average temperatures, rainfall, sunshine and the best time to visit Muriú.
Climate overview of Muriú
Muriú, Rio Grande do Norte, Brazil, has a stable climate with little temperature variation across the year. Average daytime temperatures hover around 29°C (84°F), peaking in February at 30°C (86°F) and dipping in August to 28°C (82°F).
With around 1312 mm (52 in) of annual rainfall, Muriú has a notably wet climate. However, this rainfall is not evenly distributed — the city has distinct dry (October to November) and wet (April to June) seasons. The wettest month is April. Sunshine peaks in November, when the city sees around 9.3 hours of sunshine per day.
Muriú Weather by Month
Pick a month to see the average temperature, rainfall and sunshine in Muriú — and find the best time to visit.
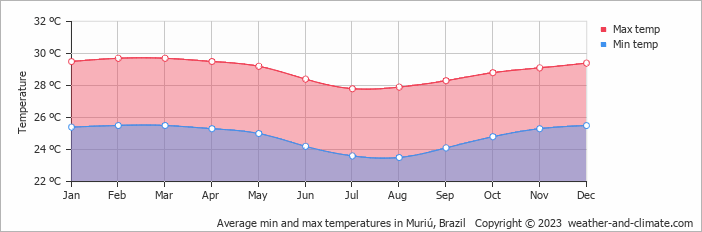
Monthly Temperature in Muriú
With minimal seasonal shifts, Muriú experiences a constant climate year-round. Average daytime temperatures reach a comfortable 30°C (86°F) in February. In August, the coolest month of the year, temperatures drop to a comfortable 28°C (82°F).
At night, temperatures range from around 26°C (79°F) in February to 24°C (75°F) in August.
Check out our detailed temperature page for more information.
Temperature ranges by month
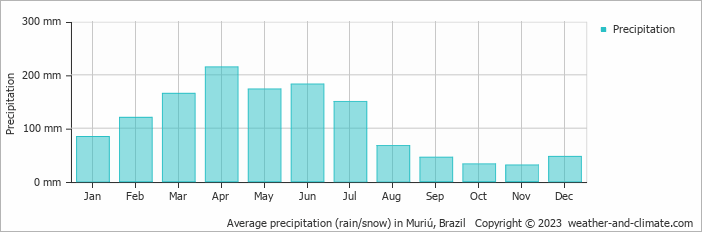
Rainfall in Muriú
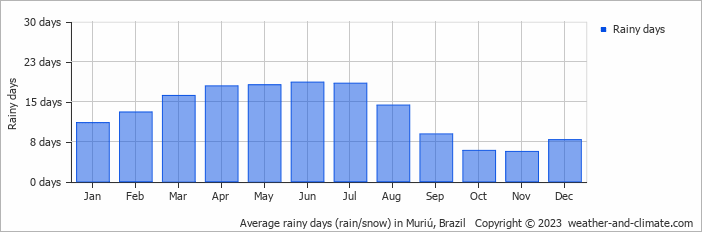
Muriú has a notably wet climate with abundant precipitation, recording 1312 mm (52 in) of rainfall per year. Muriú can be quite wet during April, receiving approximately 215 mm (8.5 in) of precipitation over 18 rainy days.
In contrast, during the driest month (November), you will experience much drier conditions, with 31 mm (1.2 in) of precipitation spread across 6 rainy days days. For more details, please visit our Muriú Precipitation page.
The mean monthly precipitation over the year, including rain, hail, and snow
The average number of days each month with precipitation
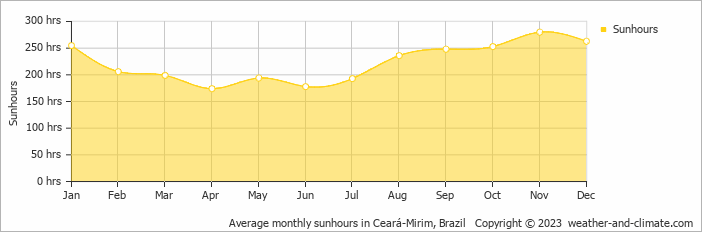
Sunshine Hours in Muriú
Muriú experiences moderate variation in sunshine hours across the seasons. With 9.3 hours daily sunshine in November, it dips to 5.8 hours in April, offering a balanced mix of sunny and overcast days.
Visit our detailed sunshine hours page for more information.
Monthly hours of sunshine
Daily hours of sunshine
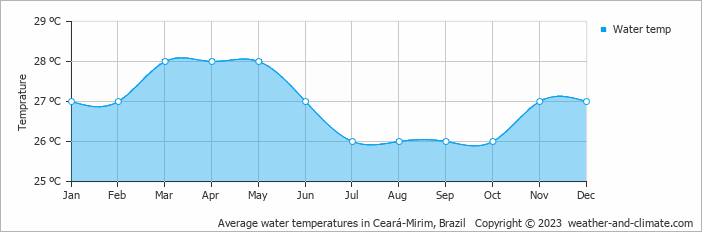
Water Temperature in Muriú
The mean water temperature over the year ranges from 26°C (79°F) in July to 28°C (82°F) in March.
Water temperature over the year
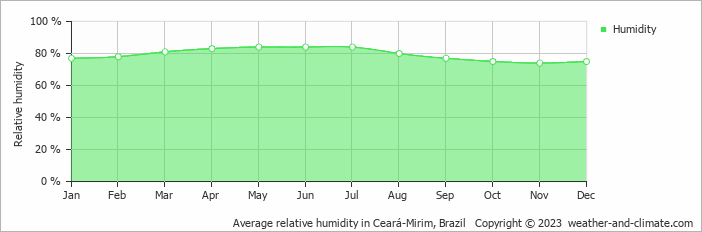
Humidity in Muriú by Month
The relative humidity is high throughout the year in Muriú.
The city experiences its highest humidity in May, reaching 84%. In November, the humidity drops to its lowest level at 74%. What does this mean? Read our detailed page on humidity levels for further details.
Relative humidity over the year
Best Time to Visit Muriú
It's smart to plan your activities during the cooler morning hours or take advantage of the refreshing evenings.
Note that March, April, May and June make up the rainy season, with heavier precipitation expected. Ready to plan your travels but need destination ideas? Our smart tool recommends places based on the climate conditions you prefer. Start planning with our destination weather tool.
Frequently asked questions about the climate in Muriú
What is the best time to visit Muriú?
August, September, October, November and December typically offer the most optimal weather in Muriú. In contrast, April tends to have less optimal conditions. Muriú has distinct dry (October to November) and wet (April to June) seasons.
What temperatures can I expect in Muriú?
Daytime highs range from 28°C (82°F) in August to 30°C (86°F) in February. Nighttime lows range from 24°C (75°F) to 26°C (79°F). Temperatures stay relatively stable year-round.
How much rain does Muriú get?
Annual rainfall is around 1312 mm (52 in). April is the wettest month with 215 mm (8.5 in), while November is the driest with 31 mm (1.2 in).
How sunny is Muriú?
Muriú receives around 2,679 hours of sunshine per year. November is the sunniest month with 280 hours, while April is the cloudiest with just 174 hours. Overall, Muriú enjoys abundant sunshine.
Muriú 3-Day Forecast
Muriú 3-Day Forecast
Muriú on the map
Muriú is highlighted — select any city to see its climate.
Popular this month
Where to go in July — average daytime high across popular destinations.
Bucket list
Need travel inspiration? Check out our bucket list articles and be inspired.
 The 10 most alternative cities in South America
Discover South America's top 10 alternative cities! From Valparaíso's vibrant streets to La Paz's high-altitude charm and Medellín's innovative spirit.
 The 5 most tranquil retreats in the Amazon Rainforest, Brazil
Discover top sustainable lodges in the Amazon. Enjoy unique wildlife, eco-friendly stays, and immersive experiences at Anavilhanas, Cristalino, and more.
An alternative way to discover Rio de Janeiro
Don't feel like seeing the traditional tourist sights in Rio de Janeiro? We have made an overview of the sights in Rio de Janeiro that you must see if you want to visit Rio in an alternative way.
Iguazu Falls
Iguazu Falls are among the largest waterfalls on earth. You will be speechless when you see this miracle of mother nature. They are included in the World Heritage List and have also been named one of the seven wonders of the world.