Mudurnu Weather & Climate: Best Time to Visit
Average temperatures, rainfall, sunshine and the best time to visit Mudurnu.
Climate overview of Mudurnu
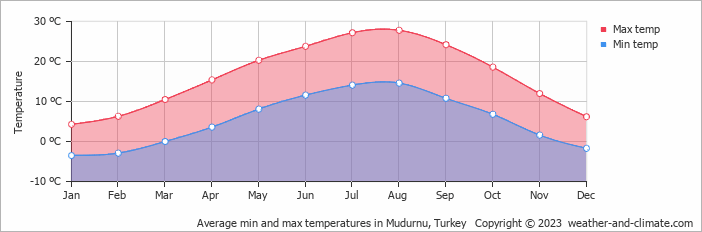
Mudurnu, Black Sea Region Turkey, Turkey, sees big temperature differences between seasons, with August peaking at 28°C (82°F) and January dropping to 4°C (39°F).
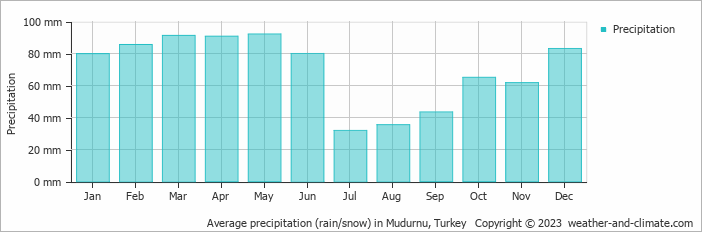
The city receives around 840 mm (33 in) of rain/snowfall per year. It experiences a distinct dry season from July to August. May is the wettest month and July the driest.
Mudurnu Weather by Month
Pick a month to see the average temperature, rainfall and sunshine in Mudurnu — and find the best time to visit.
Monthly Temperature in Mudurnu
Visitors to Mudurnu can expect significant temperature changes throughout the year. On average, daytime temperatures range from a comfortable 28°C (82°F) in August to a chilly 4°C (39°F) in January.
Nighttime temperatures range from 15°C (59°F) in August to -4°C (25°F) in January.
Check out our detailed temperature page for more information.
Temperature ranges by month
Rainfall in Mudurnu
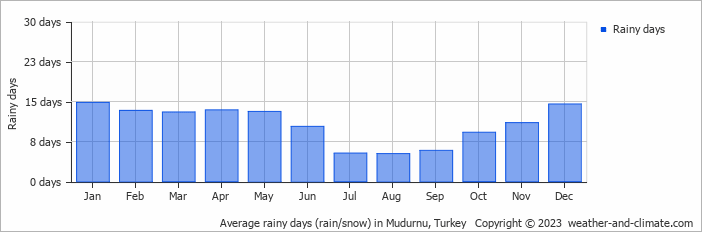
Generally, Mudurnu experiences moderate precipitation patterns, averaging 840 mm (33 in) yearly. The seasons in Mudurnu bring significant changes in precipitation. The wettest month, May, receives moderate rainfall, with an average of 92 mm (3.6 in) of precipitation. This rainfall is distributed across 13 rainy days.
In contrast, the driest month, July, experiences much less rainfall, totaling 32 mm (1.3 in) over 5 rainy days. These distinct seasonal differences provide diverse experiences throughout the year. For more details, please visit our Mudurnu Precipitation page.
The mean monthly precipitation over the year, including rain, hail, and snow
The average number of days each month with precipitation
Best Time to Visit Mudurnu
The weather does bring rainfall during this period, between 32 mm (1.3 in) and 92 mm (3.6 in). Seeking the perfect travel destination for this year? We've created a tool that suggests locations matching your desired weather. Let our weather planner guide your travel decisions.
Frequently asked questions about the climate in Mudurnu
What is the best time to visit Mudurnu?
May, June, July, August and September typically offer the most optimal weather in Mudurnu. In contrast, January, February and December tend to have less optimal conditions. Mudurnu has a distinct dry season from July to August.
What temperatures can I expect in Mudurnu?
Daytime highs range from 4°C (39°F) in January to 28°C (82°F) in August. Nighttime lows range from -4°C (25°F) to 15°C (59°F). Temperatures vary considerably through the year.
How much rain does Mudurnu get?
Annual rainfall is around 840 mm (33 in). May is the wettest month with 92 mm (3.6 in), while July is the driest with 32 mm (1.3 in).
Mudurnu 3-Day Forecast
Mudurnu 3-Day Forecast
Mudurnu on the map
Mudurnu is highlighted — select any city to see its climate.
Popular this month
Where to go in July — average daytime high across popular destinations.
Bucket list
Need travel inspiration? Check out our bucket list articles and be inspired.
 An idyllic and beautiful place to stay and eat near Saklikent National Park in Turkey
Serene Saklikent National Park near Fethiye, Turkey, with breathtaking gorges, tranquil restaurant, and unique experiences in nature. Perfect for a peaceful escape.
Sailing the Turquoise Coast: Discovering Turkey's Blue Voyage
Discover the beauty of Turkey's Turquoise Coast on a sailboat adventure, exploring ancient ruins, sun-soaked beaches, and lively harbor towns.
Balloon in Cappadocia Turkey
The best view of the special landscape of Cappadocia is from the air. It is a great idea to take a balloon trip at sunrise. An experience that belongs on your bucket list.
Istanbul, where East meets West
Istanbul, one of the most amazing cities in the world. It's a buzzing city and a mix of European and Asian, like a summer day in Madrid with a touch of Bangkok.