

















 Warm Sea Without Extreme Heat: 8 Beach Destinations With Comfortable Weather
Love warm seawater but not extreme heat? Compare eight beach destinations where the sea stays warm while daytime temperatures remain comfortable.
Average temperatures, rainfall, sunshine and the best time to visit Los Urrutias.
 –
–
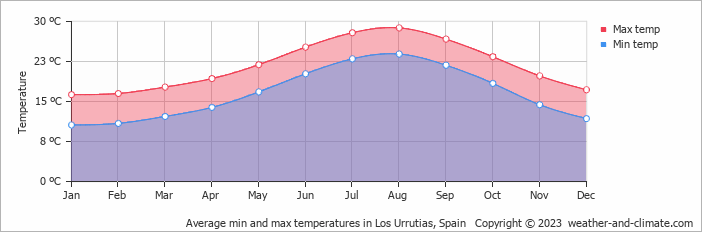
Los Urrutias, Murcia, Spain, sees big temperature differences between seasons, with August peaking at 29°C (84°F) and January dropping to 16°C (61°F).
The city tends toward dry conditions, with around 312 mm (12 in) of rainfall per year. It does, however, have a distinct dry season from December to August, with warm summers and mild winters.
Pick a month to see the average temperature, rainfall and sunshine in Los Urrutias - and find the best time to visit.
Visitors to Los Urrutias can expect significant temperature changes throughout the year. Typically, average maximum daytime temperatures range from a comfortable 29°C (84°F) in August to a moderate 16°C (61°F) in the coolest month, January.
Nights vary from 24°C (75°F) in August to around 11°C (52°F) during the colder months.
Check out our detailed temperature page for more information.
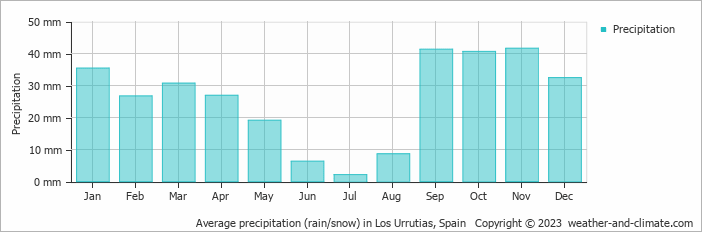
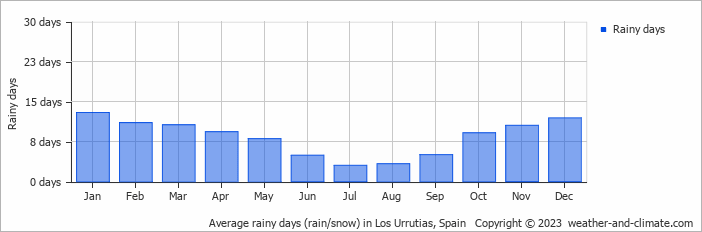
Los Urrutias typically sees modest rainfall throughout the year, with an average annual precipitation of 312 mm (12 in). The climate in Los Urrutias shows significant variation throughout the year. Expect moderate rainfall in November, the wettest month, with an average of 42 mm (1.7 in) of precipitation over 11 rainy days.
In contrast, the driest month July offers drier and sunnier days, with around 2.1 mm (0.1 in) of rainfall over 3 rainy days. For more details, please visit our Los Urrutias Precipitation page.
Monthly ratings reflect general weather comfort, based on daytime temperature and rainfall. Swimming and winter conditions are highlighted separately where relevant.
April, May, June, July, August, September, October and November typically offer the most optimal weather in Los Urrutias. In contrast, January and December tend to have less optimal conditions. Los Urrutias has a distinct dry season from December to August, with warm summers and mild winters.
Daytime highs range from 16°C (61°F) in January to 29°C (84°F) in August. Nighttime lows range from 11°C (52°F) to 24°C (75°F). Temperatures vary considerably through the year.
Annual rainfall is around 312 mm (12 in). November is the wettest month with 42 mm (1.7 in), while July is the driest with 2.1 mm (0.1 in).
Los Urrutias is highlighted - select any city to see its climate.
Where to go in October - average daytime high across popular destinations.
Need travel inspiration? Check out our bucket list articles and be inspired.
Warm Sea Without Extreme Heat: 8 Beach Destinations With Comfortable Weather
Love warm seawater but not extreme heat? Compare eight beach destinations where the sea stays warm while daytime temperatures remain comfortable.

 El Hierro: The smallest Canary island without mass tourism
Mainly nature lovers and those seeking tranquility go to El Hierro. The island is know for its beautiful mountains and you can wonder around for days here.
 Spain in October: Where Is It Warmest and Sunniest?
Discover where Spain is warmest in October, with climate comparisons for Seville, Alicante, Málaga, Tenerife, Madrid and Barcelona.
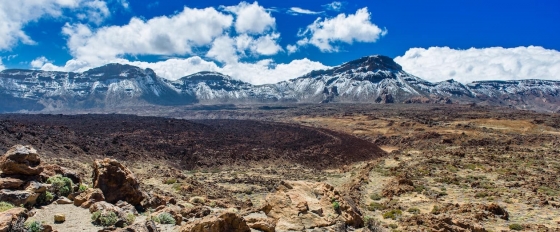 Visit national Park El Teide
This national park is truly a unique place that you should not miss. You will find landscapes that seem to come from another plane and you will feel tiny in these impressive surroundings.