Los Barriles Weather & Climate: Best Time to Visit
Average temperatures, rainfall, sunshine and the best time to visit Los Barriles.
Climate overview of Los Barriles
Los Barriles, Baja California Sur, Mexico, experiences moderate temperature changes through the seasons. July is the warmest month with daytime highs of 34°C (93°F), while January is the coolest at 25°C (77°F).
With around 327 mm (13 in) of annual rainfall, Los Barriles has a fairly dry climate. However, it has a distinct dry season from October to June. The wettest month is September, while April sees the least rain.
Los Barriles Weather by Month
Pick a month to see the average temperature, rainfall and sunshine in Los Barriles — and find the best time to visit.
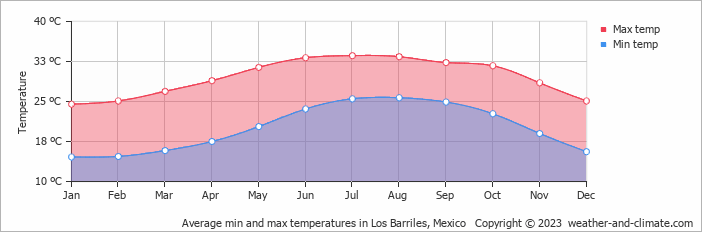
Monthly Temperature in Los Barriles
The weather in Los Barriles changes moderately throughout the year, offering enough variation to appreciate each season. Average daytime temperatures reach a very warm 34°C (93°F) in July. In January, the coolest month of the year, temperatures drop to a comfortable 25°C (77°F).
At night, temperatures range from around 26°C (79°F) in July to 15°C (59°F) in January.
Check out our detailed temperature page for more information.
Temperature ranges by month
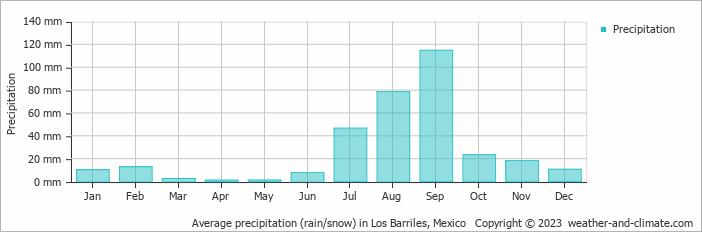
Rainfall in Los Barriles
Los Barriles maintains relatively dry conditions year-round, recording average annual precipitation of 327 mm (13 in). Los Barriles can be quite wet during September, receiving approximately 115 mm (4.5 in) of precipitation over 5 rainy days.
In contrast, during the driest month (April), you will experience much drier conditions, with 1.1 mm (0.04 in) of precipitation spread across 0 rainy days days. For more details, please visit our Los Barriles Precipitation page.
The mean monthly precipitation over the year, including rain, hail, and snow
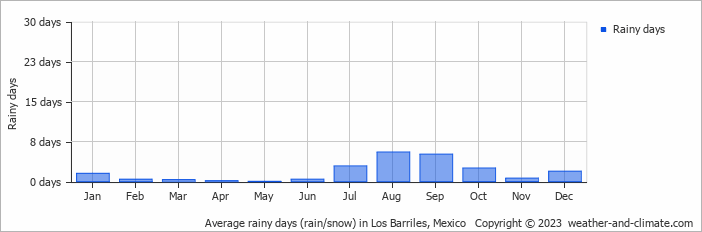
The average number of days each month with precipitation
Best Time to Visit Los Barriles
Rainfall during this time ranges from 1 mm (0.04 in) in April to 18 mm (0.7 in) in November. This means you can expect a mix of sunny days and occasional showers. Planning your next adventure but unsure where to go? Our climate tool suggests perfect locations tailored to your preferred weather conditions. Discover your ideal travel destination with our weather planner.
Frequently asked questions about the climate in Los Barriles
What is the best time to visit Los Barriles?
January, February, March, April, November and December typically offer the most optimal weather in Los Barriles. In contrast, July tends to have less optimal conditions. Los Barriles has a distinct dry season from October to June.
What temperatures can I expect in Los Barriles?
Daytime highs range from 25°C (77°F) in January to 34°C (93°F) in July. Nighttime lows range from 15°C (59°F) to 26°C (79°F).
How much rain does Los Barriles get?
Annual rainfall is around 327 mm (13 in). September is the wettest month with 115 mm (4.5 in), while April is the driest with 1.1 mm (0.04 in).
Los Barriles 3-Day Forecast
Los Barriles 3-Day Forecast
Los Barriles on the map
Los Barriles is highlighted — select any city to see its climate.
Popular this month
Where to go in July — average daytime high across popular destinations.
Bucket list
Need travel inspiration? Check out our bucket list articles and be inspired.
 Explore the Majestic Copper Canyons of Mexico
Explore the vast Copper Canyons in Chihuahua, Mexico—larger than the Grand Canyon. Discover scenic train rides, hikes, and the Tarahumara people.
These are the most beautiful Mayan ruins and Mayan temples in Mexico
Mexico is a destination where you can immerse yourself in ancient cultures and civilizations. In this article we have listed our favorite Mayan ruins.
Tips, to-do's and nicest restaurants in Mexico City
Mexico City, one of the most famous and notorious cities of the world. The best time to visit is between March and May, but it can be visited year round.
Zihuatanejo: A Pacific paradise with beautiful beaches
Zihuatanejo has some of Mexico's top beaches. Unlike other off-the-beaten-path destinations in Mexico, Zihua is very accessible and sustainable.