Las Galletas Weather & Climate: Best Time to Visit
With consistently stable weather, Las Galletas, Canary Islands, Spain, sees little seasonal temperature change. Daytime highs average 22°C (72°F), ranging from 25°C (77°F) in August to 19°C (66°F) in February.
The city has a relatively dry climate, receiving around 321 mm (13 in) of rainfall per year. It does experience a distinct dry season from January to September. December is the wettest month and July the driest. The most sunshine falls in July, with an average of 11.1 hours of daily sunshine.
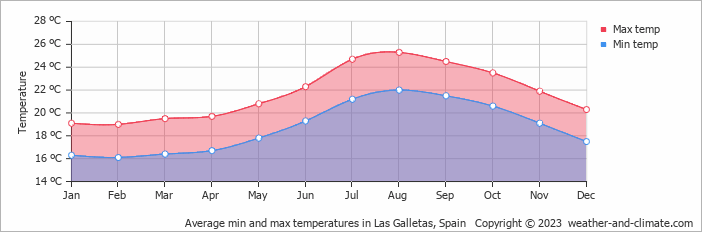
Monthly Temperature in Las Galletas
The climate in Las Galletas remains fairly constant, offering pleasant temperatures throughout the year. On average, daytime temperatures range from a comfortable 25°C (77°F) in August to a pleasant 19°C (66°F) in February.
Nighttime temperatures range from 22°C (72°F) in August to 16°C (61°F) in February.
Check out our detailed temperature page for more information.
Temperature ranges by month
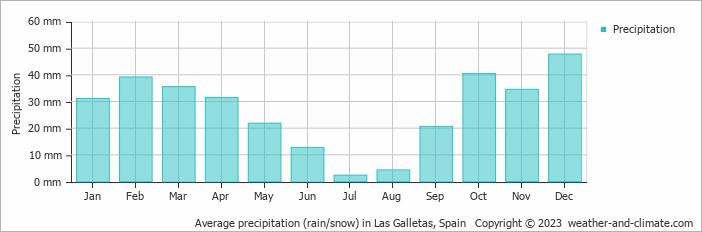
Rainfall in Las Galletas
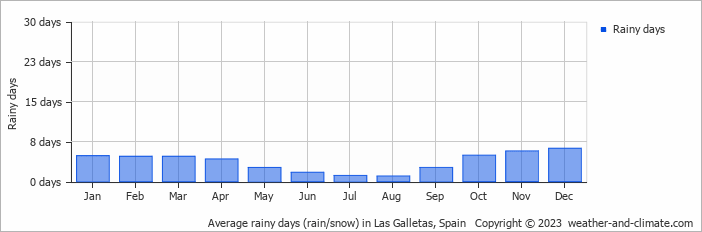
Las Galletas's climate is marked by below-average rainfall, accumulating 321 mm (13 in) of precipitation yearly. The seasons in Las Galletas bring significant changes in precipitation. The wettest month, December, receives moderate rainfall, with an average of 48 mm (1.9 in) of precipitation. This rainfall is distributed across 6 rainy days.
In contrast, the driest month, July, experiences much less rainfall, totaling 2.3 mm (0.1 in) over a single rainy day. These distinct seasonal differences provide diverse experiences throughout the year. For more details, please visit our Las Galletas Precipitation page.
The mean monthly precipitation over the year, including rain, hail, and snow
The average number of days each month with precipitation
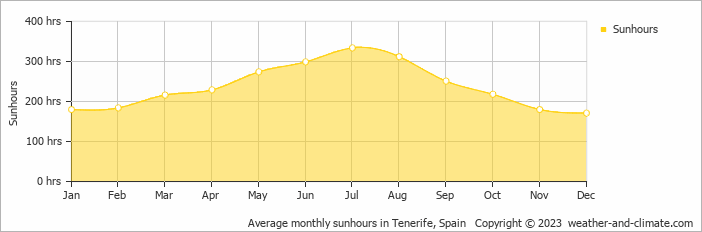
Sunshine Hours in Las Galletas
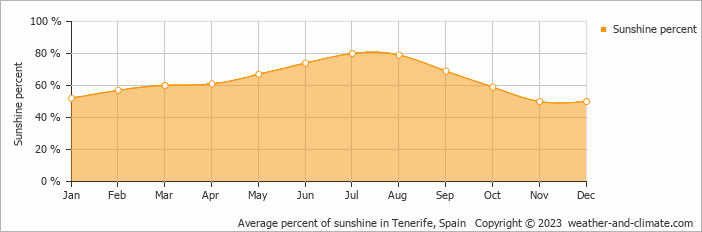
In Las Galletas, summer days are longer and more sunny, with daily sunshine hours peaking at 11.1 hours in July. As the darker season arrives, the brightness of the sun becomes less. December sees a soft sun for only 5.7 hours per average day.
Visit our detailed sunshine hours page for more information.
Monthly hours of sunshine
Daily hours of sunshine
Daily percentage of sunshine
Humidity in Las Galletas by Month
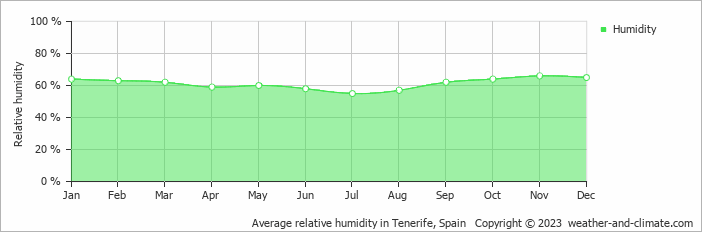
The relative humidity is high throughout the year in Las Galletas.
The city experiences its highest humidity in November, reaching 66%. In July, the humidity drops to its lowest level at 55%. What does this mean? Read our detailed page on humidity levels for further details.
Relative humidity over the year
Las Galletas 3-Day Forecast
Check the conditions for any month of the year.
Best Time to Visit Las Galletas
The exceptional weather stability in Las Galletas provides comfortable temperatures between 19°C (66°F) and 25°C (78°F) throughout every month of the year. This consistent climate removes all guesswork from travel planning, though the drier periods offer optimal conditions.While you can visit anytime with confidence, the drier months like July (with just 2 mm (0.1 in) rainfall) provide the most favorable conditions for extended outdoor exploration and flexible itineraries. Looking for inspiration on where to travel this year? We have a tool that recommends destinations based on your ideal conditions. Find out where to go with our weather planner.


