La Ceja Weather & Climate: Best Time to Visit
La Ceja, Colombia, has a stable climate with little temperature variation across the year. Average daytime temperatures hover around 25°C (77°F), peaking in August at 26°C (79°F) and dipping in July to 24°C (75°F).
The city receives considerable rainfall, with around 3092 mm (122 in) annually. April is the wettest month. Sunshine peaks in July, when the city sees around 6.7 hours of sunshine per day.
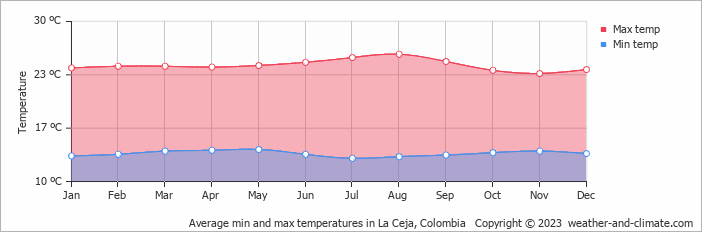
Monthly Temperature in La Ceja
With minimal seasonal shifts, La Ceja experiences a constant climate year-round. Typically, average maximum daytime temperatures range from a comfortable 26°C (79°F) in August to a comfortable 24°C (75°F) in the coolest month, July.
Nights vary from 14°C (57°F) in August to around 13°C (55°F) during the colder months.
Check out our detailed temperature page for more information.
Temperature ranges by month
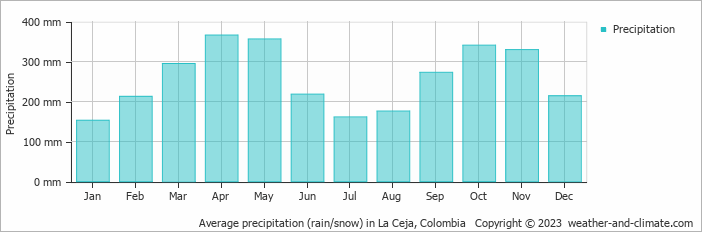
Rainfall in La Ceja
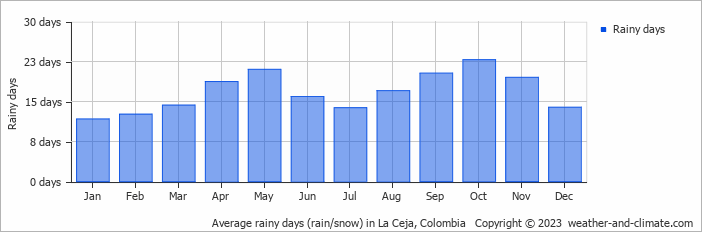
La Ceja has a notably wet climate with abundant precipitation, recording 3092 mm (122 in) of rainfall per year. The climate in La Ceja shows significant variation throughout the year. Expect heavy rainfall in April, the wettest month, with an average of 366 mm (14 in) of precipitation over 19 rainy days.
In contrast, the driest month January offers drier and sunnier days, with around 153 mm (6 in) of rainfall over 12 rainy days. For more details, please visit our La Ceja Precipitation page.
The mean monthly precipitation over the year, including rain, hail, and snow
The average number of days each month with precipitation
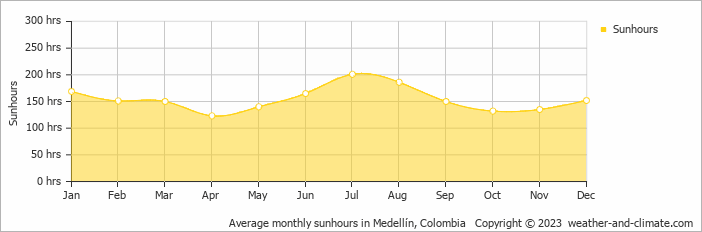
Sunshine Hours in La Ceja
La Ceja offers a pleasant mix of sunny and slightly overcast days. The difference in sunshine hours between July (6.7 hours daily) and April (4.1 hours daily) provides a bit of variety for visitors and residents.
Visit our detailed sunshine hours page for more information.
Monthly hours of sunshine
Daily hours of sunshine
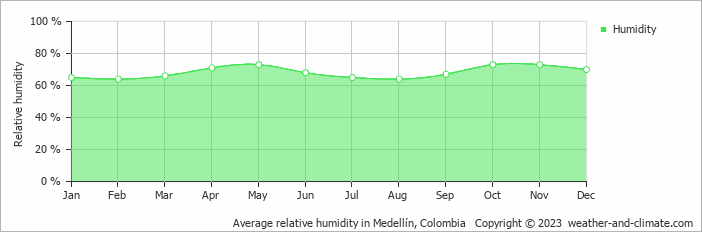
Humidity in La Ceja by Month
The relative humidity is high throughout the year in La Ceja.
The city experiences its highest humidity in May, reaching 73%. In February, the humidity drops to its lowest level at 64%. What does this mean? Read our detailed page on humidity levels for further details.
Relative humidity over the year
La Ceja 3-Day Forecast
Check the conditions for any month of the year.


