La Cavada Weather & Climate: Best Time to Visit
Average temperatures, rainfall, sunshine and the best time to visit La Cavada.
Climate overview of La Cavada
The climate in La Cavada, Cantabria, Spain, is marked by large temperature swings across the seasons, ranging from 24°C (75°F) in August to 12°C (54°F) in February.
With around 1236 mm (49 in) of annual rainfall, La Cavada has a notably wet climate. The wettest month is November. The most sunshine falls in July, with an average of 7.5 hours of daily sunshine.
La Cavada Weather by Month
Pick a month to see the average temperature, rainfall and sunshine in La Cavada — and find the best time to visit.
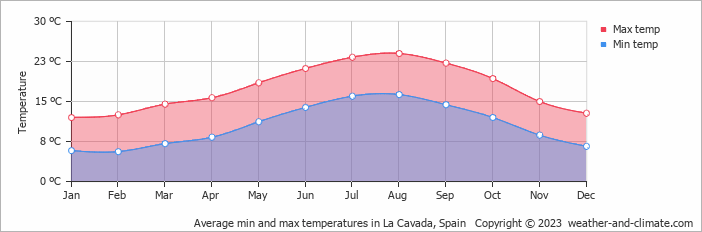
Monthly Temperature in La Cavada
In La Cavada, temperatures differ significantly between summer and winter months. Average daytime temperatures reach a comfortable 24°C (75°F) in August. In February, the coolest month of the year, temperatures drop to a moderate 12°C (54°F).
At night, temperatures range from around 16°C (61°F) in August to 6°C (43°F) in February.
Check out our detailed temperature page for more information.
Temperature ranges by month
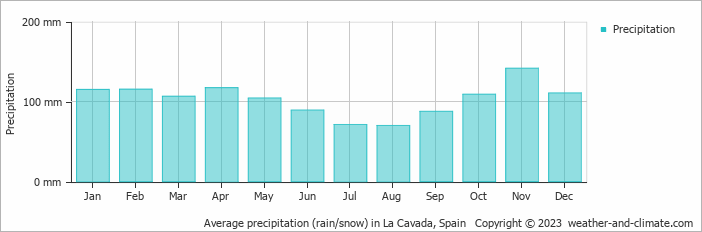
Rainfall in La Cavada
La Cavada experiences significant rainfall throughout the year, averaging 1236 mm (49 in) of precipitation annually. La Cavada experiences moderate seasonal variation in rainfall, with monthly averages ranging from 141 mm (5.6 in) in November, the wettest month, and 70 mm (2.8 in) in August, the driest month. For more details, please visit our La Cavada Precipitation page.
The mean monthly precipitation over the year, including rain, hail, and snow
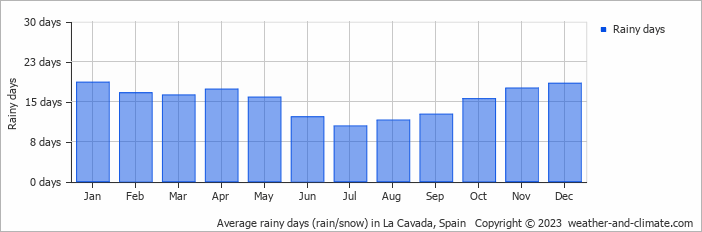
The average number of days each month with precipitation
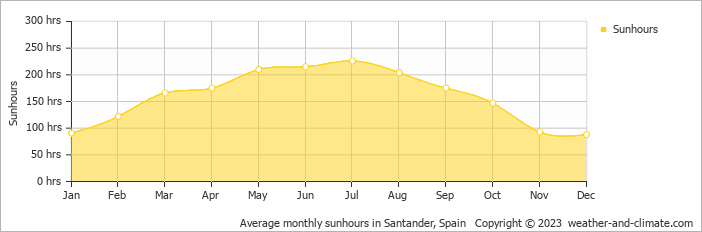
Sunshine Hours in La Cavada
La Cavada can be enjoyed more throughout the sunniest month of July under a blue sky, with approximately 7.5 hours of sunshine daily. In contrast, the city experiences much darker days in December, with only 2.9 hours of sunlight per day.
Visit our detailed sunshine hours page for more information.
Monthly hours of sunshine
Daily hours of sunshine
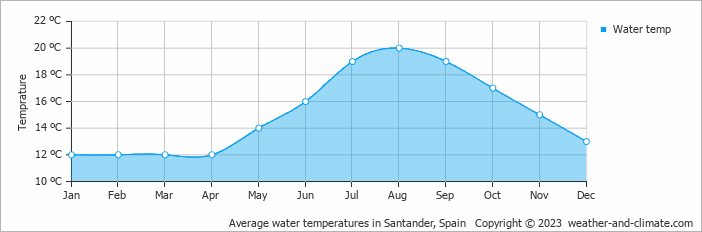
Water Temperature in La Cavada
The mean water temperature over the year ranges from 12°C (54°F) in January to 20°C (68°F) in August.
Water temperature over the year
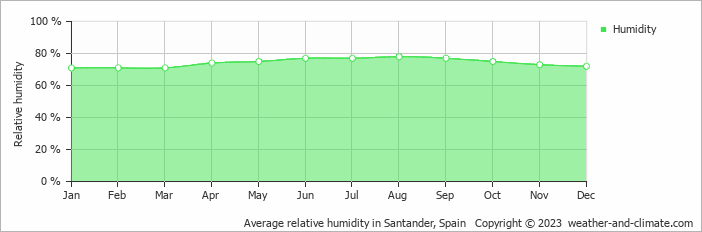
Humidity in La Cavada by Month
The relative humidity is high throughout the year in La Cavada.
The city experiences its highest humidity in August, reaching 78%. In January, the humidity drops to its lowest level at 71%. What does this mean? Read our detailed page on humidity levels for further details.
Relative humidity over the year
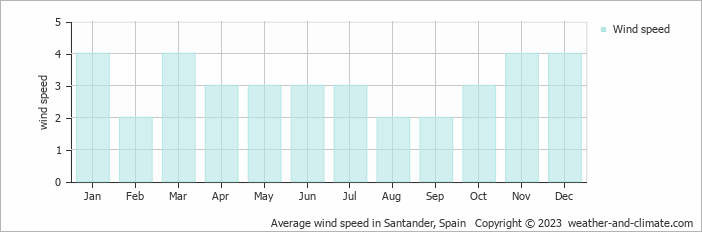
Wind Speed in La Cavada
The average wind speed over the year ranges from 2 m/s (4 knots) to 4 m/s (8 knots). It is lower in February, August and September and higher in January, March, November and December. What does this mean?
The mean monthly wind speed over the year (meters per second)
Best Time to Visit La Cavada
Frequently asked questions about the climate in La Cavada
What is the best time to visit La Cavada?
June, July, August and September typically offer the most optimal weather in La Cavada. In contrast, January, February and December tend to have less optimal conditions.
What temperatures can I expect in La Cavada?
Daytime highs range from 12°C (54°F) in February to 24°C (75°F) in August. Nighttime lows range from 6°C (43°F) to 16°C (61°F). Temperatures vary considerably through the year.
How much rain does La Cavada get?
Annual rainfall is around 1236 mm (49 in). November is the wettest month with 141 mm (5.6 in), while August is the driest with 70 mm (2.8 in).
How sunny is La Cavada?
La Cavada receives around 1,912 hours of sunshine per year. July is the sunniest month with 226 hours, while December is the cloudiest with just 88 hours.
La Cavada 3-Day Forecast
La Cavada 3-Day Forecast
La Cavada on the map
La Cavada is highlighted — select any city to see its climate.
Popular this month
Where to go in June — average daytime high across popular destinations.
Bucket list
Need travel inspiration? Check out our bucket list articles and be inspired.
 El Hierro: The smallest Canary island without mass tourism
Mainly nature lovers and those seeking tranquility go to El Hierro. The island is know for its beautiful mountains and you can wonder around for days here.
Visit national Park El Teide
This national park is truly a unique place that you should not miss. You will find landscapes that seem to come from another plane and you will feel tiny in these impressive surroundings.
Sevilla: A Blend of Tradition, Culture, and Hidden Gems
Experience Sevilla in spring with Semana Santa processions and Feria de Abril festivities, set against the city's iconic landmarks and vibrant culture.
Enjoy an active trip in the mountains of Sierras de Cazorla
The mountains of Sierras de Cazorla offer spectacular views and sights and an abundance of activities that you can engage in, most of which are eco-friendly!