La Cavada Precipitation: Average Monthly Rainfall and Snowfall
This graph shows the average amount of rainfall per month in La Cavada (Cantabria). The numbers are calculated over a 30-year period to provide a reliable average.
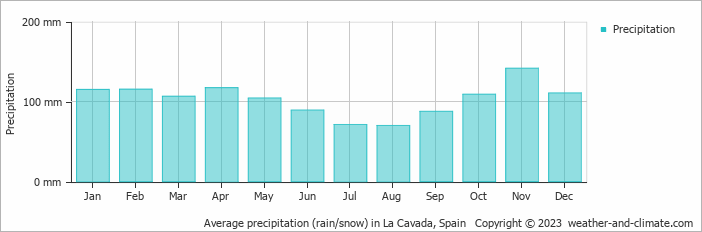
- A lot of rain (rainy season) falls in the months: January, February, March, April, May, October, November and December.
- On average, November is the wettest month with 141 mm of precipitation.
- On average, August is the driest month with 70 mm of precipitation.
- The average amount of annual precipitation is 1236 mm.
Current rainfall in La Cavada
Fri Nov 15
20°C | 7°C
SE  7 km/h
7 km/halmost clear and no rain
Sat Nov 16
20°C | 10°C
S 11 km/h
11 km/hpartly cloudy and no rain
Sun Nov 17
15°C | 10°C
N 7 km/h
7 km/h1.4 mm
overcast and rain


