Kupand Weather & Climate: Best Time to Visit
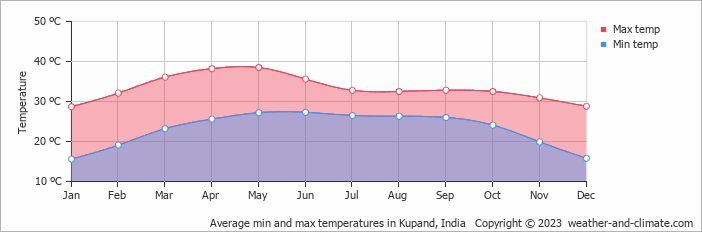
Kupand, India, experiences moderate temperature changes through the seasons. May is the warmest month with daytime highs of 39°C (102°F), while January is the coolest at 29°C (84°F).
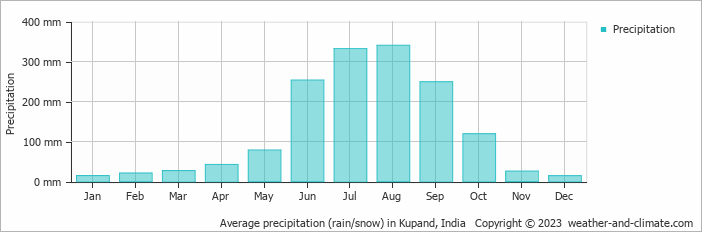
With around 1515 mm (60 in) of annual rainfall, Kupand has a notably wet climate. However, this rainfall is not evenly distributed — the city has distinct dry (November to March) and wet (June to September) seasons. The wettest month is August.
Monthly Temperature in Kupand
The weather in Kupand changes moderately throughout the year, offering enough variation to appreciate each season. Average daytime temperatures reach a very hot 39°C (102°F) in May. In January, the coolest month of the year, temperatures drop to a comfortable 29°C (84°F).
At night, temperatures range from around 27°C (81°F) in May to 16°C (61°F) in January.
Check out our detailed temperature page for more information.
Temperature ranges by month
Rainfall in Kupand
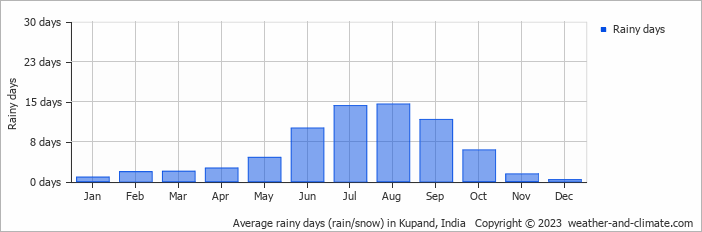
Kupand has a relatively rainy climate with high precipitation levels, averaging 1515 mm (60 in) of rainfall annually. Kupand can be quite wet during August, receiving approximately 340 mm (13 in) of precipitation over 15 rainy days.
In contrast, during the driest month (December), you will experience much drier conditions, with 14 mm (0.6 in) of precipitation spread across 0 rainy days days. For more details, please visit our Kupand Precipitation page.
The mean monthly precipitation over the year, including rain, hail, and snow
The average number of days each month with precipitation
Kupand 3-Day Forecast
Check the conditions for any month of the year.
Best Time to Visit Kupand
Kupand has warm weather with temperatures ranging from 29°C (84°F) to 39°C (102°F) throughout the year. The best time to visit is during January, February, March, April, November and December, when rainfall is at its lowest, making it a great time for sightseeing and exploring all the place has to offer.For a more comfortable experience, start your day early when the weather is cooler, or take advantage of the gentle breezes in the late afternoon.
The rainy season occurs during June, July, August and September, when the area experiences its heaviest rainfall. Planning your next adventure but unsure where to go? Our climate tool suggests perfect locations tailored to your preferred weather conditions. Discover your ideal travel destination with our weather planner.


