Kızılot Weather & Climate: Best Time to Visit
Average temperatures, rainfall, sunshine and the best time to visit Kızılot.
Climate overview of Kızılot
Kızılot, Mediterranean Region Turkey, Turkey, sees big temperature differences between seasons, with August peaking at 32°C (90°F) and January dropping to 14°C (57°F).
Kızılot sees a moderate amount of rainfall, totalling around 979 mm (39 in) per year. It experiences a distinct dry season from June to September, creating some seasonal variation. The most sunshine falls in July, with an average of 10.4 hours of daily sunshine.
Kızılot Weather by Month
Pick a month to see the average temperature, rainfall and sunshine in Kızılot — and find the best time to visit.
Monthly Temperature in Kızılot
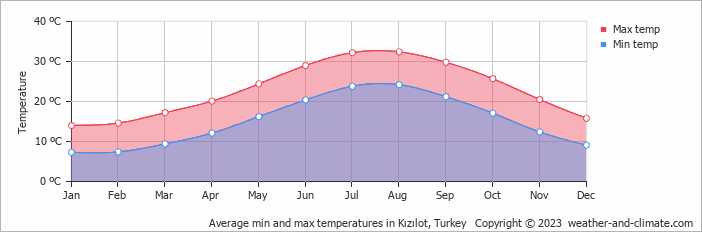
Visitors to Kızılot can expect significant temperature changes throughout the year. Average maximum daytime temperatures range from a very warm 32°C (90°F) in August, the warmest time of the year, to a moderate 14°C (57°F) during cooler months like January.
At night, you can expect temperatures ranging from 24°C (75°F) in August to around 7°C (45°F) during January.
Check out our detailed temperature page for more information.
Temperature ranges by month
Rainfall in Kızılot
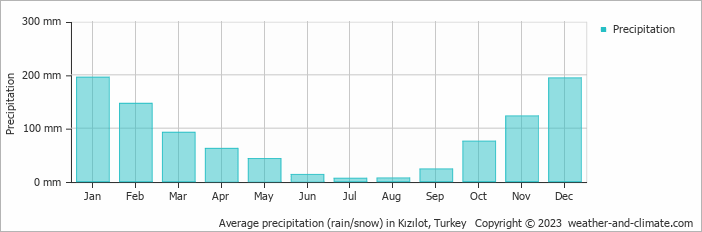
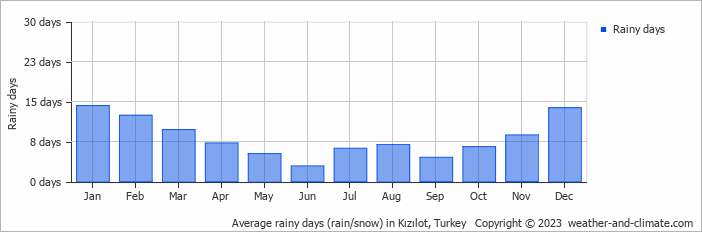
Generally, Kızılot experiences moderate precipitation patterns, averaging 979 mm (39 in) yearly. Significant seasonal changes in precipitation occur throughout the year. In the wettest month, January it receives heavy rainfall, averaging 195 mm (7.7 in) of precipitation, recorded across 14 rainy days. In contrast, the driest month July brings less rainfall, with 5.8 mm (0.2 in) over 6 rainy days. For more details, please visit our Kızılot Precipitation page.
The mean monthly precipitation over the year, including rain, hail, and snow
The average number of days each month with precipitation
Sunshine Hours in Kızılot
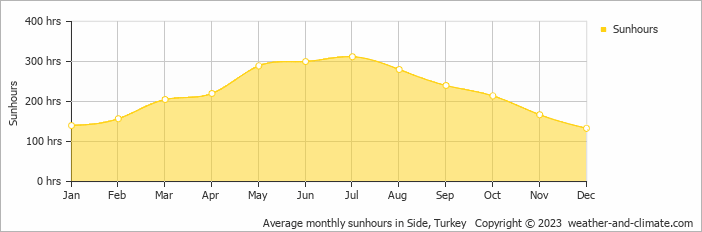
Seasonal changes in sunshine hours are quite dramatic in Kızılot. While July receives considerable daily sunshine with up to 10.4 hours, December marks the darkest time of the year, where sunshine is scarce with only 4.4 hours of sunlight per day.
Visit our detailed sunshine hours page for more information.
Monthly hours of sunshine
Daily hours of sunshine
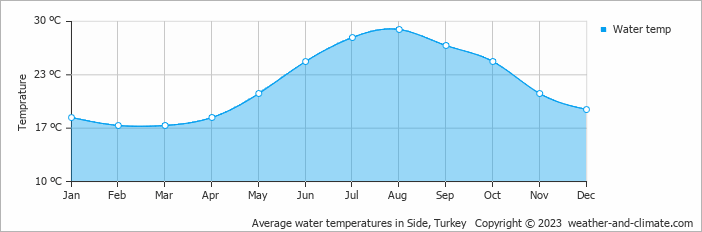
Water Temperature in Kızılot
The mean water temperature over the year ranges from 17°C (63°F) in February to 29°C (84°F) in August.
Water temperature over the year
Best Time to Visit Kızılot
The weather does bring rainfall during this period, between 13 mm (0.5 in) and 123 mm (4.8 in).
Plan accordingly for January and December, when conditions bring the heaviest precipitation. Looking for inspiration on where to travel this year? We have a tool that recommends destinations based on your ideal conditions. Find out where to go with our weather planner.
Frequently asked questions about the climate in Kızılot
What is the best time to visit Kızılot?
April, May, June and October typically offer the most optimal weather in Kızılot. In contrast, January and December tend to have less optimal conditions. Kızılot has a distinct dry season from June to September.
What temperatures can I expect in Kızılot?
Daytime highs range from 14°C (57°F) in January to 32°C (90°F) in August. Nighttime lows range from 7°C (45°F) to 24°C (75°F). Temperatures vary considerably through the year.
How much rain does Kızılot get?
Annual rainfall is around 979 mm (39 in). January is the wettest month with 195 mm (7.7 in), while July is the driest with 5.8 mm (0.2 in).
How sunny is Kızılot?
Kızılot receives around 2,657 hours of sunshine per year. July is the sunniest month with 312 hours, while December is the cloudiest with just 133 hours. Overall, Kızılot enjoys abundant sunshine.
Kızılot 3-Day Forecast
Kızılot 3-Day Forecast
Kızılot on the map
Kızılot is highlighted — select any city to see its climate.
Popular this month
Where to go in July — average daytime high across popular destinations.
Bucket list
Need travel inspiration? Check out our bucket list articles and be inspired.
 An idyllic and beautiful place to stay and eat near Saklikent National Park in Turkey
Serene Saklikent National Park near Fethiye, Turkey, with breathtaking gorges, tranquil restaurant, and unique experiences in nature. Perfect for a peaceful escape.
Sailing the Turquoise Coast: Discovering Turkey's Blue Voyage
Discover the beauty of Turkey's Turquoise Coast on a sailboat adventure, exploring ancient ruins, sun-soaked beaches, and lively harbor towns.
Balloon in Cappadocia Turkey
The best view of the special landscape of Cappadocia is from the air. It is a great idea to take a balloon trip at sunrise. An experience that belongs on your bucket list.
Istanbul, where East meets West
Istanbul, one of the most amazing cities in the world. It's a buzzing city and a mix of European and Asian, like a summer day in Madrid with a touch of Bangkok.