Kazanlŭk Weather & Climate: Best Time to Visit
Average temperatures, rainfall, sunshine and the best time to visit Kazanlŭk.
Climate overview of Kazanlŭk
Kazanlŭk, Stara Zagora, Bulgaria, sees big temperature differences between seasons, with August peaking at 29°C (84°F) and January dropping to 5°C (41°F).
With around 871 mm (34 in) of annual rain/snowfall, the city has moderate precipitation levels. May is the wettest month and January the driest.
Kazanlŭk Weather by Month
Pick a month to see the average temperature, rainfall and sunshine in Kazanlŭk — and find the best time to visit.
Monthly Temperature in Kazanlŭk
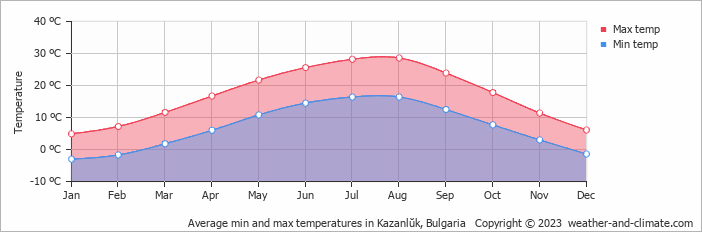
Visitors to Kazanlŭk can expect significant temperature changes throughout the year. Typically, average maximum daytime temperatures range from a comfortable 29°C (84°F) in August to a chilly 5°C (41°F) in the coolest month, January.
Nights vary from 16°C (61°F) in August to around -3°C (27°F) during the colder months.
Check out our detailed temperature page for more information.
Temperature ranges by month
Rainfall in Kazanlŭk
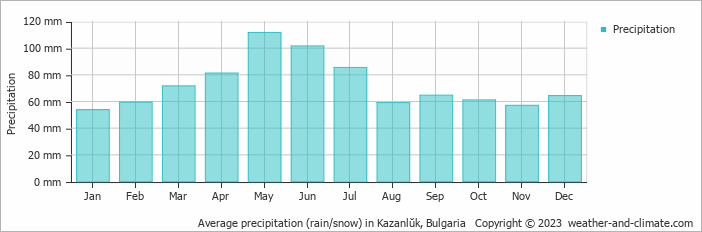
Generally, Kazanlŭk experiences moderate precipitation patterns, averaging 871 mm (34 in) yearly. Kazanlŭk offers a pleasant mix of wetter and slightly drier months. The difference in precipitation between the wettest month May (112 mm (4.4 in)) and the driest month January (54 mm (2.1 in)) is not too significant. For more details, please visit our Kazanlŭk Precipitation page.
The mean monthly precipitation over the year, including rain, hail, and snow
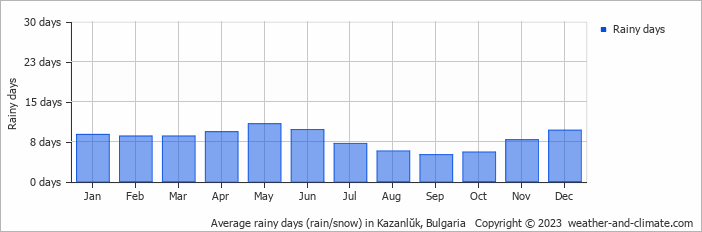
The average number of days each month with precipitation
Best Time to Visit Kazanlŭk
The weather does bring rainfall during this period, between 59 mm (2.3 in) and 112 mm (4.4 in). Wondering where to travel based on your weather preferences? Our recommendation tool helps you find destinations with your ideal climate conditions. Use our weather planner to find your perfect destination.
Frequently asked questions about the climate in Kazanlŭk
What is the best time to visit Kazanlŭk?
July, August and September typically offer the most optimal weather in Kazanlŭk. In contrast, January, February and December tend to have less optimal conditions.
What temperatures can I expect in Kazanlŭk?
Daytime highs range from 5°C (41°F) in January to 29°C (84°F) in August. Nighttime lows range from -3°C (27°F) to 16°C (61°F). Temperatures vary considerably through the year.
How much rain does Kazanlŭk get?
Annual rainfall is around 871 mm (34 in). May is the wettest month with 112 mm (4.4 in), while January is the driest with 54 mm (2.1 in).
Kazanlŭk 3-Day Forecast
Kazanlŭk 3-Day Forecast
Kazanlŭk on the map
Kazanlŭk is highlighted — select any city to see its climate.
Popular this month
Where to go in July — average daytime high across popular destinations.
Bucket list
Need travel inspiration? Check out our bucket list articles and be inspired.
 7 of the most budget-friendly destinations in Europe
Discover Europe's top budget-friendly destinations including Budapest, Kotor, Krakow, and more, perfect for affordable and exciting travel.
 Meadows in the mountains
Meadows in the mountains is a world away from large line-ups and huge crowds. High in the Rhodope Mountains in Bulgaria.
 Cycle the Danube trail
The Danube cycle route is one of the most popular cycling routes in Europe, and rightly so, because it is a varied route that is interesting both in terms of culture and nature.