Jhājra Weather & Climate: Best Time to Visit
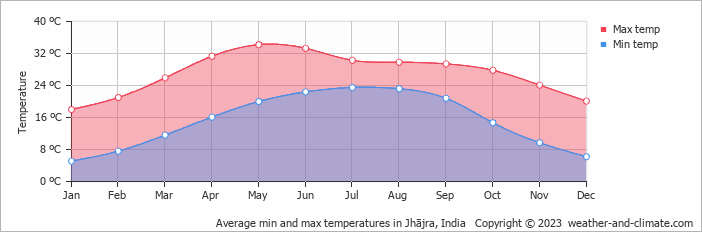
Temperatures in Jhājra, India, vary greatly throughout the year. May is the hottest month at 34°C (93°F), while January is the coldest at 18°C (64°F).
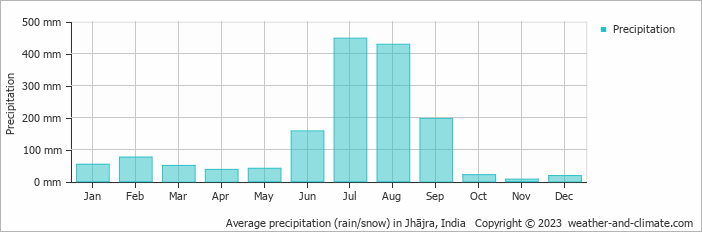
The city receives considerable rainfall, with around 1533 mm (60 in) annually. July is the wettest month. It has distinct dry (October to December) and wet (July to September) seasons.
Monthly Temperature in Jhājra
The climate in Jhājra is known for significant temperature differences throughout the year, making the weather dynamic. Typically, average maximum daytime temperatures range from a very warm 34°C (93°F) in May to a pleasant 18°C (64°F) in the coolest month, January.
Nights vary from 24°C (75°F) in May to around 5°C (41°F) during the colder months.
Check out our detailed temperature page for more information.
Temperature ranges by month
Rainfall in Jhājra
Jhājra has a notably wet climate with abundant precipitation, recording 1533 mm (60 in) of rainfall per year. The climate in Jhājra shows significant variation throughout the year. Expect heavy rainfall in July, the wettest month, with an average of 447 mm (18 in) of precipitation over 17 rainy days.
In contrast, the driest month November offers drier and sunnier days, with around 6.8 mm (0.3 in) of rainfall over a single rainy day. For more details, please visit our Jhājra Precipitation page.
The mean monthly precipitation over the year, including rain, hail, and snow
The average number of days each month with precipitation

Jhājra 3-Day Forecast
Check the conditions for any month of the year.
Best Time to Visit Jhājra
Jhājra's weather is most enjoyable during January, February, March, October, November and December, with comfortable temperatures from 18°C (64°F) to 28°C (82°F). The moderate conditions ensure pleasant weather for exploring the area. Expect varied weather during this period with rainfall between 7 mm (0.3 in) and 76 mm (3 in), providing a good balance of sunny and rainy days.The wettest months are July, August and September, when precipitation is at its highest. Planning your next adventure but unsure where to go? Our climate tool suggests perfect locations tailored to your preferred weather conditions. Discover your ideal travel destination with our weather planner.


