Jaguarão Weather & Climate: Best Time to Visit
Average temperatures, rainfall, sunshine and the best time to visit Jaguarão.
Climate overview of Jaguarão
Jaguarão, Rio Grande do Sul, Brazil, sees big temperature differences between seasons, with January peaking at 30°C (86°F) and July dropping to 18°C (64°F).
The city has a wet climate, receiving around 1312 mm (52 in) of rainfall per year. October is the wettest month.
Jaguarão Weather by Month
Pick a month to see the average temperature, rainfall and sunshine in Jaguarão — and find the best time to visit.
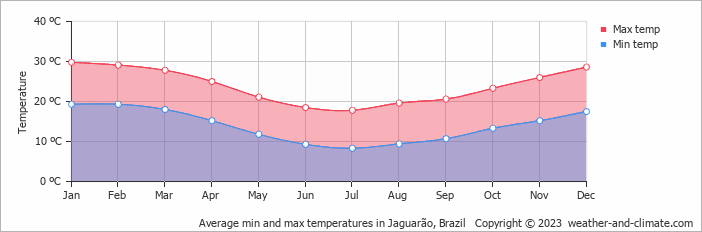
Monthly Temperature in Jaguarão
Visitors to Jaguarão can expect significant temperature changes throughout the year. On average, daytime temperatures range from a comfortable 30°C (86°F) in January to a moderate 18°C (64°F) in July.
Nighttime temperatures range from 19°C (66°F) in January to 8°C (46°F) in July.
Check out our detailed temperature page for more information.
Temperature ranges by month
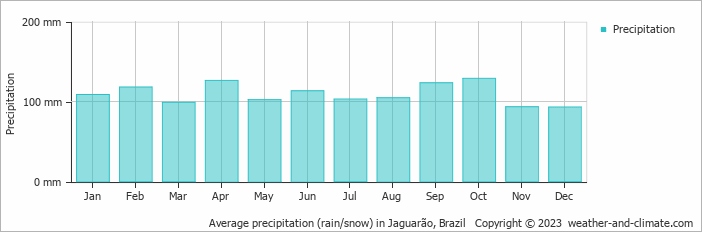
Rainfall in Jaguarão
Jaguarão is known for its substantial rainfall, with annual precipitation reaching 1312 mm (52 in). The wettest period in Jaguarão occurs in October, which receives around 129 mm (5.1 in) of precipitation. During the driest month, December, Jaguarão experiences moderate rainfall, totaling 93 mm (3.7 in). The consistent precipitation levels throughout the year contribute to a relatively stable climate. For more details, please visit our Jaguarão Precipitation page.
The mean monthly precipitation over the year, including rain, hail, and snow
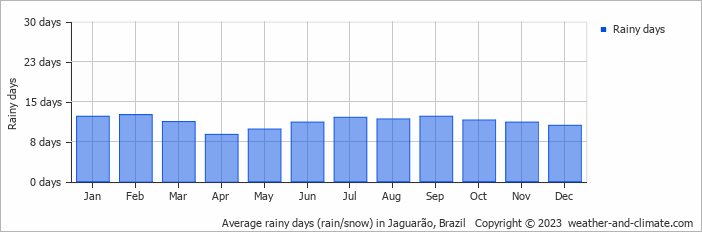
The average number of days each month with precipitation
Best Time to Visit Jaguarão
The weather does bring rainfall during this period, between 93 mm (3.7 in) and 105 mm (4.1 in). Seeking the perfect travel destination for this year? We've created a tool that suggests locations matching your desired weather. Let our weather planner guide your travel decisions.
Frequently asked questions about the climate in Jaguarão
What is the best time to visit Jaguarão?
March, November and December typically offer the most optimal weather in Jaguarão. In contrast, January tends to have less optimal conditions.
What temperatures can I expect in Jaguarão?
Daytime highs range from 18°C (64°F) in July to 30°C (86°F) in January. Nighttime lows range from 8°C (46°F) to 19°C (66°F). Temperatures vary considerably through the year.
How much rain does Jaguarão get?
Annual rainfall is around 1312 mm (52 in). October is the wettest month with 129 mm (5.1 in), while December is the driest with 93 mm (3.7 in).
Jaguarão 3-Day Forecast
Jaguarão 3-Day Forecast
Jaguarão on the map
Jaguarão is highlighted — select any city to see its climate.
Popular this month
Where to go in July — average daytime high across popular destinations.
Bucket list
Need travel inspiration? Check out our bucket list articles and be inspired.
 The 10 most alternative cities in South America
Discover South America's top 10 alternative cities! From Valparaíso's vibrant streets to La Paz's high-altitude charm and Medellín's innovative spirit.
 The 5 most tranquil retreats in the Amazon Rainforest, Brazil
Discover top sustainable lodges in the Amazon. Enjoy unique wildlife, eco-friendly stays, and immersive experiences at Anavilhanas, Cristalino, and more.
An alternative way to discover Rio de Janeiro
Don't feel like seeing the traditional tourist sights in Rio de Janeiro? We have made an overview of the sights in Rio de Janeiro that you must see if you want to visit Rio in an alternative way.
Iguazu Falls
Iguazu Falls are among the largest waterfalls on earth. You will be speechless when you see this miracle of mother nature. They are included in the World Heritage List and have also been named one of the seven wonders of the world.