












Igando Weather & Climate: Best Time to Visit
Average temperatures, rainfall, sunshine and the best time to visit Igando.
Climate overview of Igando
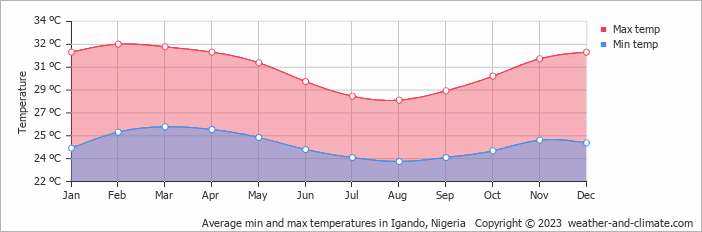
With consistently stable weather, Igando, Nigeria, sees little seasonal temperature change. Daytime highs average 31°C (88°F), ranging from 32°C (90°F) in February to 28°C (82°F) in August.
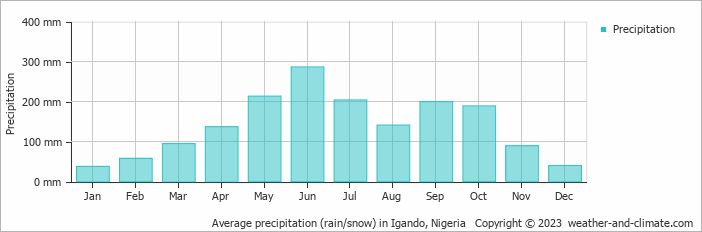
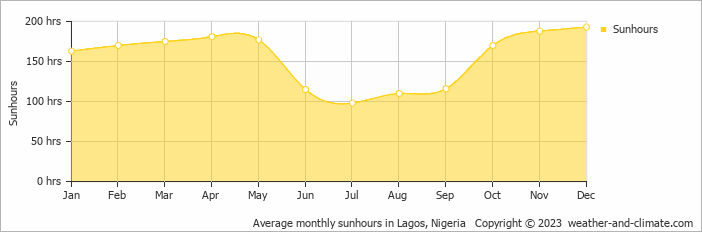
With around 1685 mm (66 in) of annual rainfall, Igando has a notably wet climate. However, this rainfall is not evenly distributed — the city has distinct dry (December to January) and wet (May to July) seasons. The wettest month is June. The sunniest month is December, with 6.4 hours of sunshine per day on average.
Igando Weather by Month
Pick a month to see the average temperature, rainfall and sunshine in Igando — and find the best time to visit.
Monthly Temperature in Igando
The climate in Igando remains fairly constant, offering very warm temperatures throughout the year. Average daytime temperatures reach a very warm 32°C (90°F) in February. In August, the coolest month of the year, temperatures drop to a comfortable 28°C (82°F).
At night, temperatures range from around 26°C (79°F) in February to 24°C (75°F) in August.
Check out our detailed temperature page for more information.
Temperature ranges by month
Rainfall in Igando
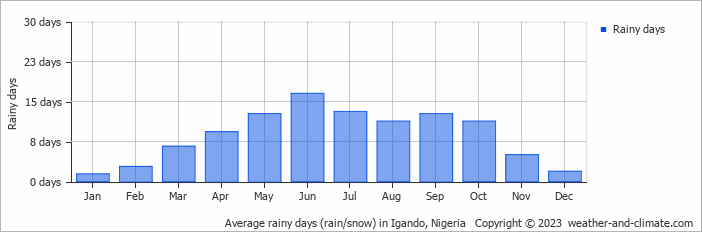
Igando is known for its substantial rainfall, with annual precipitation reaching 1685 mm (66 in). Igando can be quite wet during June, receiving approximately 286 mm (11 in) of precipitation over 17 rainy days.
In contrast, during the driest month (January), you will experience much drier conditions, with 37 mm (1.5 in) of precipitation spread across a single rainy day days. For more details, please visit our Igando Precipitation page.
The mean monthly precipitation over the year, including rain, hail, and snow
Sunshine Hours in Igando
Igando can be enjoyed more throughout the sunniest month of December under a blue sky, with approximately 6.4 hours of sunshine daily. In contrast, the city experiences much darker days in July, with only 3.3 hours of sunlight per day.
Visit our detailed sunshine hours page for more information.
Monthly hours of sunshine
Daily hours of sunshine
Humidity in Igando by Month
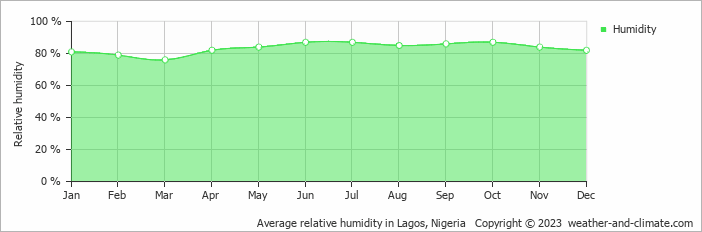
The city experiences its highest humidity in June, reaching 87%. In March, the humidity drops to its lowest level at 76%. What does this mean? Read our detailed page on humidity levels for further details.
Relative humidity over the year
Best Time to Visit Igando
Make your experience more enjoyable by planning to be outside during the cooler parts of the day, either early morning or as the sun begins to set. Visitors should note that May, June, July, September and October are part of the rainy season, bringing substantial rainfall. Ready to plan your travels but need destination ideas? Our smart tool recommends places based on the climate conditions you prefer. Start planning with our destination weather tool.
Frequently asked questions about the climate in Igando
What is the best time to visit Igando?
August typically offers the most optimal weather in Igando. In contrast, May, June and October tend to have less optimal conditions. Igando has distinct dry (December to January) and wet (May to July) seasons.
What temperatures can I expect in Igando?
Daytime highs range from 28°C (82°F) in August to 32°C (90°F) in February. Nighttime lows range from 24°C (75°F) to 26°C (79°F). Temperatures stay relatively stable year-round.
How much rain does Igando get?
Annual rainfall is around 1685 mm (66 in). June is the wettest month with 286 mm (11 in), while January is the driest with 37 mm (1.5 in).
How sunny is Igando?
Igando receives around 1,856 hours of sunshine per year. December is the sunniest month with 193 hours, while July is the cloudiest with just 98 hours.
Igando 3-Day Forecast
Igando on the map
Igando is highlighted — select any city to see its climate.
Popular this month
Where to go in July — average daytime high across popular destinations.
Bucket list
Need travel inspiration? Check out our bucket list articles and be inspired.