















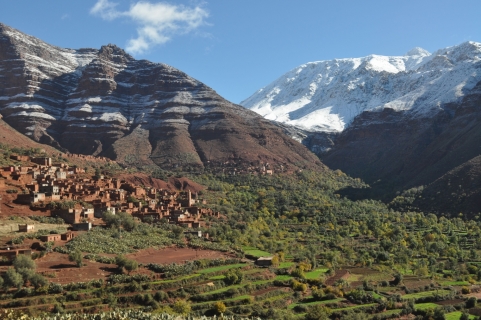
 The Atlas Mountains in Morocco
This mountain range is the second highest mountains in the world and is certainly one of the most natural and wonderful mountains you could ever visit. One for the bucket list for sure.
Average temperatures, rainfall, sunshine and the best time to visit El Harhoura.
 –
–
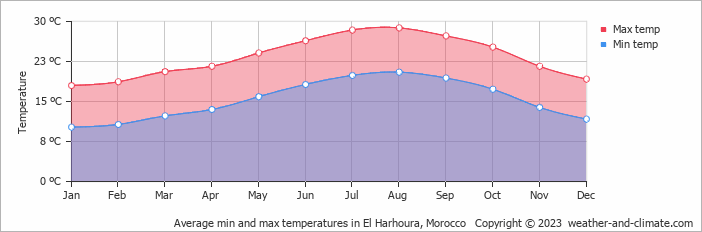
The climate in El Harhoura, Rabat-Salé-Kénitra, Morocco, sees a moderate range of temperatures across the year, from 29°C (84°F) in August down to 18°C (64°F) in January.
With around 450 mm (18 in) of annual rainfall, El Harhoura has a fairly dry climate. However, it has a distinct dry season from May to September, with warm summers and pleasant winters. The wettest month is November, while July sees the least rain. July is the sunniest month, averaging 10.5 hours of sunshine per day.
Pick a month to see the average temperature, rainfall and sunshine in El Harhoura - and find the best time to visit.
The weather in El Harhoura changes moderately throughout the year, offering enough variation to appreciate each season. Average daytime temperatures reach a comfortable 29°C (84°F) in August. In January, the coolest month of the year, temperatures drop to a pleasant 18°C (64°F).
At night, temperatures range from around 21°C (70°F) in August to 10°C (50°F) in January.
Check out our detailed temperature page for more information.
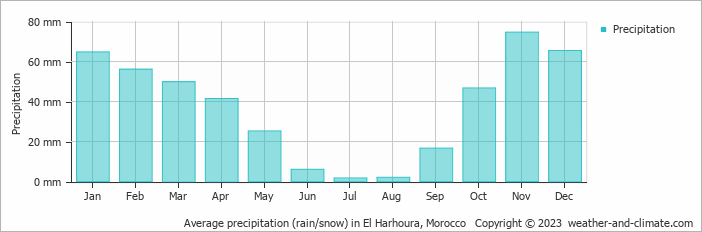
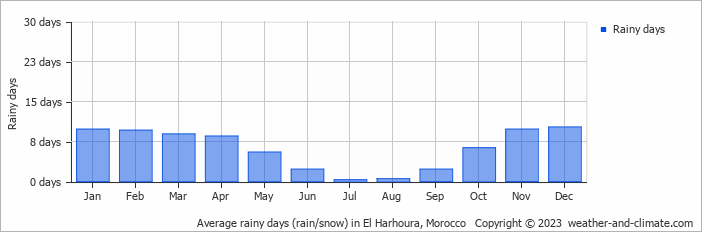
El Harhoura's climate is marked by below-average rainfall, accumulating 450 mm (18 in) of precipitation yearly. El Harhoura can be quite wet during November, receiving approximately 75 mm (3 in) of precipitation over 10 rainy days.
In contrast, during the driest month (July), you will experience much drier conditions, with 1.7 mm (0.1 in) of precipitation spread across 0 rainy days. For more details, please visit our El Harhoura Precipitation page.
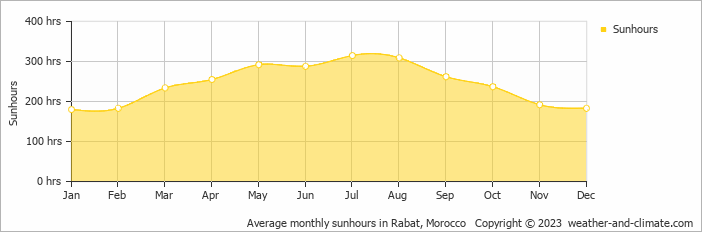
El Harhoura can be enjoyed more throughout the sunniest month of July under a blue sky, with approximately 10.5 hours of sunshine daily. In contrast, the city experiences much darker days in January, with only 6.0 hours of sunlight per day.
Visit our detailed sunshine hours page for more information.
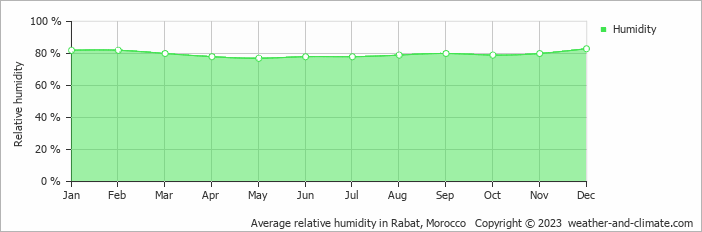
The relative humidity is high throughout the year in El Harhoura.
The city experiences its highest humidity in December, reaching 83%. In May, the humidity drops to its lowest level at 77%. What does this mean? Read our detailed page on humidity levels for further details.
Monthly ratings reflect general weather comfort, based on daytime temperature and rainfall. Swimming and winter conditions are highlighted separately where relevant.
March, April, May, June, July, August, September, October and November typically offer the most optimal weather in El Harhoura. In contrast, January, February and December tend to have less optimal conditions. El Harhoura has a distinct dry season from May to September, with warm summers and pleasant winters.
Daytime highs range from 18°C (64°F) in January to 29°C (84°F) in August. Nighttime lows range from 10°C (50°F) to 21°C (70°F).
Annual rainfall is around 450 mm (18 in). November is the wettest month with 75 mm (3 in), while July is the driest with 1.7 mm (0.1 in).
El Harhoura receives around 2,930 hours of sunshine per year. July is the sunniest month with 315 hours, while January is the cloudiest with just 180 hours. Overall, El Harhoura enjoys abundant sunshine.
El Harhoura is highlighted - select any city to see its climate.
Where to go in October - average daytime high across popular destinations.
Merzouga30°C (86°F) Marrakech 28°C (82°F) Fez27°C (81°F) Agadir26°C (79°F) Rabat25°C (77°F) Casablanca25°C (77°F) Essaouira24°C (75°F) Tangier24°C (75°F)
 Need travel inspiration? Check out our bucket list articles and be inspired.
The Atlas Mountains in Morocco
This mountain range is the second highest mountains in the world and is certainly one of the most natural and wonderful mountains you could ever visit. One for the bucket list for sure.
 Where to Go for Christmas: Sun, Value and Fewer Crowds
Where can you find warm Christmas weather without peak-season prices and huge crowds? Compare Marsa Alam, The Gambia, Vietnam, Agadir and Cap Skirring.

 Warm Days, Cool Nights: 8 Destinations With the Perfect Day-Night Temperature
Prefer warm sunny days but cool evenings? Compare eight destinations with daytime temperatures of around 25–30°C, cooler nights, low rainfall and plenty of sunshine.
 Morocco in October: Where Is the Best Weather?
Compare Morocco weather in October for Marrakesh, Agadir, Essaouira, Fez and Merzouga to find the warmest, driest and sunniest places.