Darıca Weather & Climate: Best Time to Visit
Average temperatures, rainfall, sunshine and the best time to visit Darıca.
Climate overview of Darıca
Darıca, Black Sea Region Turkey, Turkey, experiences significant temperature variation throughout the year. Summers bring daytime highs of 25°C (77°F) in August, while winters cool to 9°C (48°F) in February.
The city has a wet climate, receiving around 1441 mm (57 in) of rain/snowfall per year. September is the wettest month. The most sunshine falls in June, with an average of 7.0 hours of daily sunshine.
Darıca Weather by Month
Pick a month to see the average temperature, rainfall and sunshine in Darıca — and find the best time to visit.
Monthly Temperature in Darıca
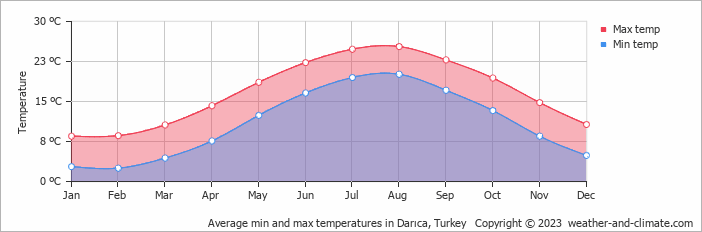
Depending on the time of the year, temperatures range from comfortable to chilly in Darıca. On average, daytime temperatures range from a comfortable 25°C (77°F) in August to a chilly 9°C (48°F) in February.
Nighttime temperatures range from 20°C (68°F) in August to 3°C (37°F) in February.
Check out our detailed temperature page for more information.
Temperature ranges by month
Rainfall in Darıca
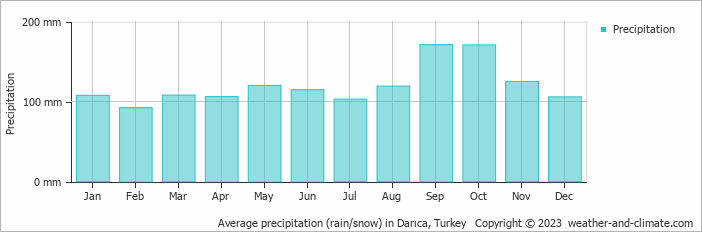
Darıca has a relatively rain/snowy climate with high precipitation levels, averaging 1441 mm (57 in) of rain/snowfall annually. The amount of precipitation varies moderately throughout the year. The wettest month, September, sees around 171 mm (6.7 in) of rainfall, perfect for those who enjoy a bit of rain now and then. The driest month, February, still receives a respectable 92 mm (3.6 in) of rainfall. For more details, please visit our Darıca Precipitation page.
The mean monthly precipitation over the year, including rain, hail, and snow
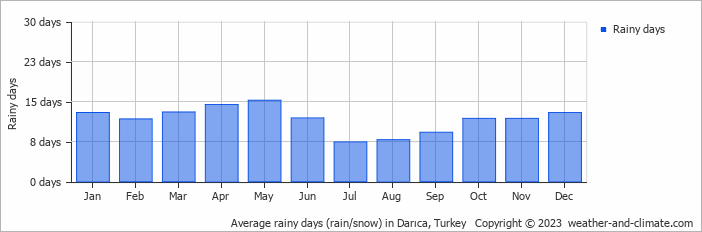
The average number of days each month with precipitation
Sunshine Hours in Darıca
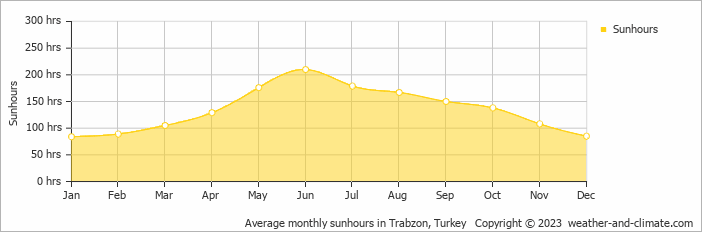
In Darıca, summer days are longer and more sunny, with daily sunshine hours peaking at 7.0 hours in June. As the darker season arrives, the brightness of the sun becomes less. January sees a soft sun for only 2.8 hours per average day.
Visit our detailed sunshine hours page for more information.
Monthly hours of sunshine
Daily hours of sunshine
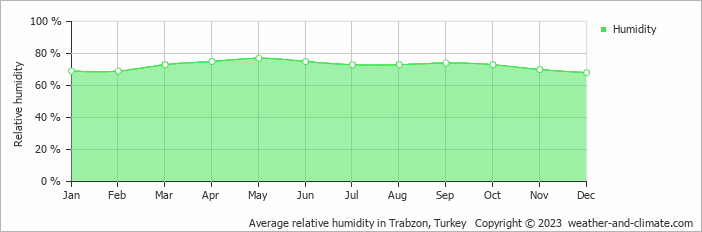
Humidity in Darıca by Month
The relative humidity is high throughout the year in Darıca.
The city experiences its highest humidity in May, reaching 77%. In December, the humidity drops to its lowest level at 68%. What does this mean? Read our detailed page on humidity levels for further details.
Relative humidity over the year
Best Time to Visit Darıca
Rainfall during this time ranges from 103 mm (4.1 in) in July to 120 mm (4.7 in) in May. This means you can expect a mix of sunny days and occasional showers.
The rainy season falls during September and October, bringing heavy precipitation. Seeking the perfect travel destination for this year? We've created a tool that suggests locations matching your desired weather. Let our weather planner guide your travel decisions.
Frequently asked questions about the climate in Darıca
What is the best time to visit Darıca?
June, July, August and September typically offer the most optimal weather in Darıca. In contrast, January, February, March and December tend to have less optimal conditions.
What temperatures can I expect in Darıca?
Daytime highs range from 9°C (48°F) in February to 25°C (77°F) in August. Nighttime lows range from 3°C (37°F) to 20°C (68°F). Temperatures vary considerably through the year.
How much rain does Darıca get?
Annual rainfall is around 1441 mm (57 in). September is the wettest month with 171 mm (6.7 in), while February is the driest with 92 mm (3.6 in).
How sunny is Darıca?
Darıca receives around 1,620 hours of sunshine per year. June is the sunniest month with 210 hours, while January is the cloudiest with just 84 hours.
Darıca 3-Day Forecast
Darıca 3-Day Forecast
Darıca on the map
Darıca is highlighted — select any city to see its climate.
Popular this month
Where to go in July — average daytime high across popular destinations.
Bucket list
Need travel inspiration? Check out our bucket list articles and be inspired.
 An idyllic and beautiful place to stay and eat near Saklikent National Park in Turkey
Serene Saklikent National Park near Fethiye, Turkey, with breathtaking gorges, tranquil restaurant, and unique experiences in nature. Perfect for a peaceful escape.
Sailing the Turquoise Coast: Discovering Turkey's Blue Voyage
Discover the beauty of Turkey's Turquoise Coast on a sailboat adventure, exploring ancient ruins, sun-soaked beaches, and lively harbor towns.
Balloon in Cappadocia Turkey
The best view of the special landscape of Cappadocia is from the air. It is a great idea to take a balloon trip at sunrise. An experience that belongs on your bucket list.
Istanbul, where East meets West
Istanbul, one of the most amazing cities in the world. It's a buzzing city and a mix of European and Asian, like a summer day in Madrid with a touch of Bangkok.