Conca dei Marini Weather and Climate: A Comprehensive Guide
The climate in Conca dei Marini is marked by big temperature swings throughout the year.
Temperatures range from warm during the warmest months
to mild in the cooler months.
It is also known for its large amounts of rainfall.
Let's now guide you through the climate details for a complete overview.
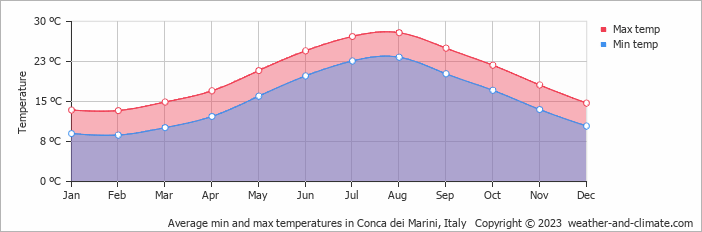
Average maximum day and minimum night temperature
In Conca dei Marini, temperatures differ significantly between summer and winter months. Typically, average maximum daytime temperatures range from a comfortable 28°C in August to a moderate 13°C in the coolest month, February.
Nights are cooler, with lows often dropping to around 9°C during the colder months.Check out our detailed temperature page for more information.
Temperature ranges by month
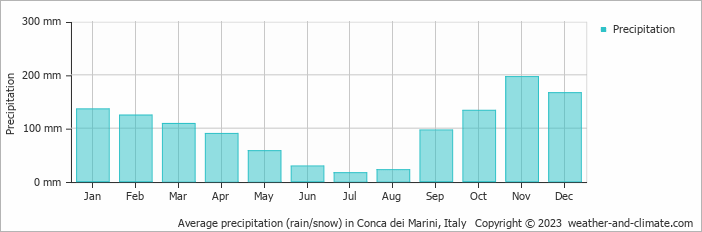
Precipitation and rainy days
Conca dei Marini experiences significant rainfall throughout the year, averaging 1175 mm of precipitation annually. The climate in Conca dei Marini shows significant variation throughout the year. Expect heavy rainfall in November, with an average of 196 mm of precipitation over 14 rainy days.
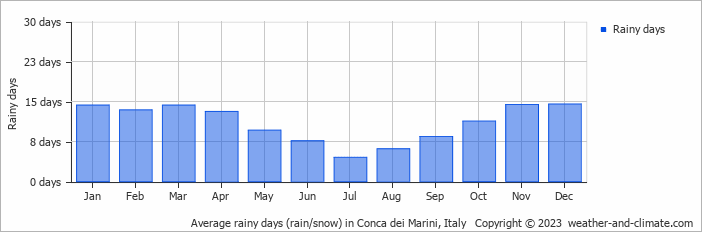
In contrast, July offers drier and sunnier days, with around 16 mm of rainfall over 5 rainy days. For more details, please visit our Conca dei Marini Precipitation page.The mean monthly precipitation over the year, including rain, hail and snow
The average number of days each month with precipitation
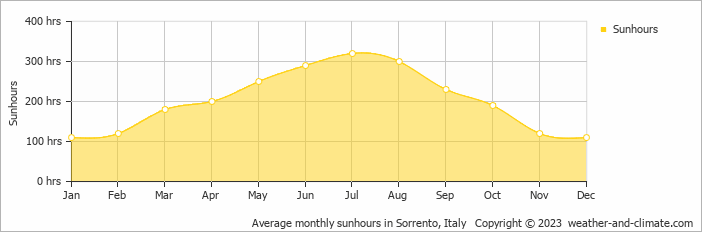
Sunshine over the year
For those who appreciate different seasons, Conca dei Marini serves as an ideal destination. Expect longer, more sun-filled days in July with an average of 10.7 hours of sunshine daily, and embrace the darker days in January, offering only 3.7 hours of daily sunlight.
Visit our detailed sunshine hours page for more information.
Monthly hours of sunshine
Daily hours of sunshine
Average humidity
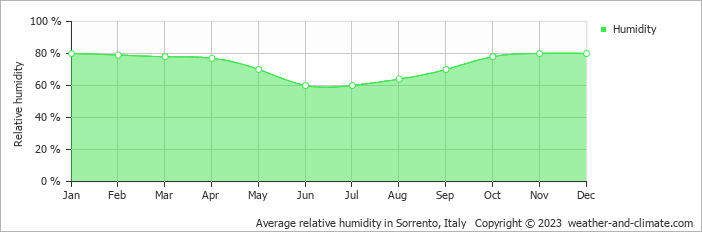
The relative humidity is high throughout the year in Conca dei Marini.
The city experiences its highest humidity in January, reaching 80%. In June, the humidity drops to its lowest level at 60%. What does this mean? Read our detailed page on humidity levels for further details.
Relative humidity over the year
Forecast for Conca dei Marini


Select a Month of Interest
Check the conditions for any month of the year.
The best time of year to visit Conca dei Marini in Italy
During the months of May, June, September and October you are most likely to experience good weather with pleasant average temperatures that fall between 20°C and 26°C.Other facts from our historical weather data:
The hottest season / summer takes place in June, July, August and September.
Most rainfall (rainy season) is seen in November and December.
August has an average maximum temperature of 28°C and is the warmest month of the year.
The coldest month is February with an average maximum temperature of 13°C.
November tops the wettest month list with 196 mm of rainfall.
July is the driest month with 16 mm of precipitation.
July is the sunniest month with an average of 320 hours of sunshine.
No idea where to travel to this year? We have a tool that recommends destinations based on your ideal conditions. Find out where to go with our weather planner.


