Chilanga Weather & Climate: Best Time to Visit
Average temperatures, rainfall, sunshine and the best time to visit Chilanga.
Climate overview of Chilanga
The climate in Chilanga, Zambia, sees a moderate range of temperatures across the year, from 33°C (91°F) in October down to 24°C (75°F) in July.
The city has a wet climate, receiving around 1018 mm (40 in) of rainfall per year. Despite the high annual total, it has distinct dry (April to October) and wet (December to February) seasons. January is the wettest month. Sunshine peaks in August, when the city sees around 10.2 hours of sunshine per day.
Chilanga Weather by Month
Pick a month to see the average temperature, rainfall and sunshine in Chilanga — and find the best time to visit.
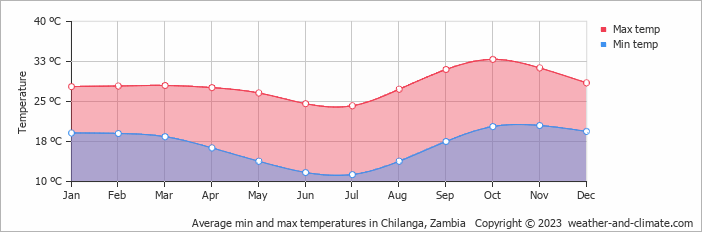
Monthly Temperature in Chilanga
In Chilanga, seasonal changes bring about a moderate variation in temperatures. On average, daytime temperatures range from a very warm 33°C (91°F) in October to a comfortable 24°C (75°F) in July.
Nighttime temperatures range from 21°C (70°F) in October to 11°C (52°F) in July.
Check out our detailed temperature page for more information.
Temperature ranges by month
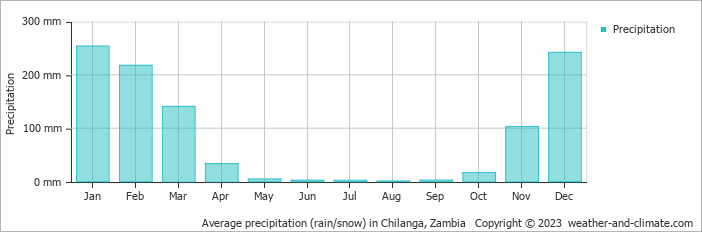
Rainfall in Chilanga
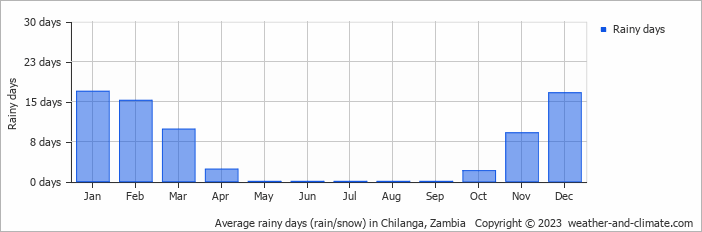
Chilanga experiences significant rainfall throughout the year, averaging 1018 mm (40 in) of precipitation annually. The seasons in Chilanga bring significant changes in precipitation. The wettest month, January, receives heavy rainfall, with an average of 254 mm (10 in) of precipitation. This rainfall is distributed across 17 rainy days.
In contrast, the driest month, August, experiences much less rainfall, totaling 0.8 mm (0.03 in) over 0 rainy days. These distinct seasonal differences provide diverse experiences throughout the year. For more details, please visit our Chilanga Precipitation page.
The mean monthly precipitation over the year, including rain, hail, and snow
The average number of days each month with precipitation
Sunshine Hours in Chilanga
In Chilanga, summer days are longer and more sunny, with daily sunshine hours peaking at 10.2 hours in August. As the darker season arrives, the brightness of the sun becomes less. February sees a soft sun for only 5.7 hours per average day.
Visit our detailed sunshine hours page for more information.
Monthly hours of sunshine

Daily hours of sunshine
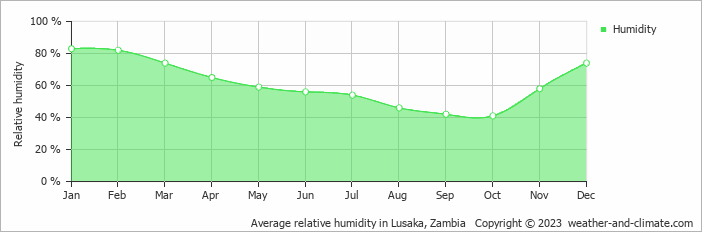
Humidity in Chilanga by Month
The relative humidity is high throughout the year in Chilanga.
The city experiences its highest humidity in January, reaching 83%. In October, the humidity drops to its lowest level at 41%. What does this mean? Read our detailed page on humidity levels for further details.
Relative humidity over the year
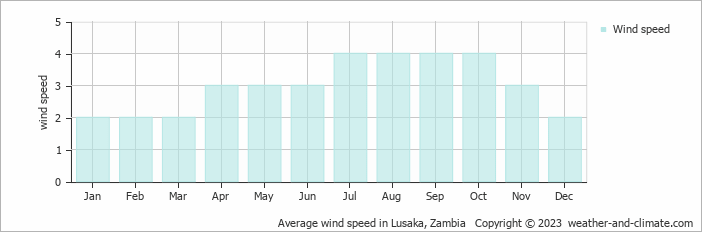
Wind Speed in Chilanga
The average wind speed over the year ranges from 2 m/s (4 knots) to 4 m/s (8 knots). It is lower in January, February, March and December and higher in July, August, September and October. What does this mean?
The mean monthly wind speed over the year (meters per second)
Best Time to Visit Chilanga
Be prepared for heavier rainfall during January, February and December, the wettest period of the year. Seeking the perfect travel destination for this year? We've created a tool that suggests locations matching your desired weather. Let our weather planner guide your travel decisions.
Frequently asked questions about the climate in Chilanga
What is the best time to visit Chilanga?
April, May, June, July and August typically offer the most optimal weather in Chilanga. In contrast, January, February, November and December tend to have less optimal conditions. Chilanga has distinct dry (April to October) and wet (December to February) seasons.
What temperatures can I expect in Chilanga?
Daytime highs range from 24°C (75°F) in July to 33°C (91°F) in October. Nighttime lows range from 11°C (52°F) to 21°C (70°F).
How much rain does Chilanga get?
Annual rainfall is around 1018 mm (40 in). January is the wettest month with 254 mm (10 in), while August is the driest with 0.8 mm (0.03 in).
How sunny is Chilanga?
Chilanga receives around 2,956 hours of sunshine per year. August is the sunniest month with 305 hours, while February is the cloudiest with just 170 hours. Overall, Chilanga enjoys abundant sunshine.
Chilanga 3-Day Forecast
Chilanga 3-Day Forecast
Chilanga on the map
Chilanga is highlighted — select any city to see its climate.
Popular this month
Where to go in July — average daytime high across popular destinations.
Bucket list
Need travel inspiration? Check out our bucket list articles and be inspired.
 The world famous Victoria Falls in Zambia
The world famous Victoria Falls is one of the 7 natural wonders of the world for a reason. It is absolutely magnificent to see.
 5 Untouched Safari Destinations in Africa
Discover Africa's hidden national parks, from Zambia's Liuwa Plain to Zimbabwe's Matusadona, offering unique wildlife experiences off the beaten path.