Average monthly wind speed in Chilanga
Here you can view the typical wind conditions throughout the year in Chilanga, (), Zambia.
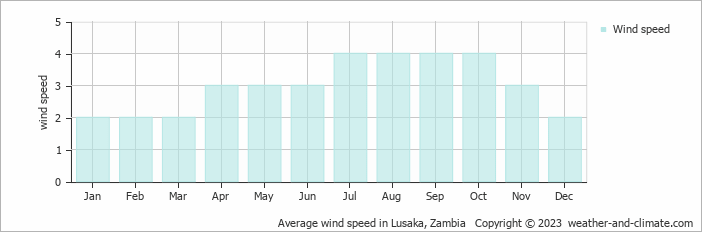
Throughout the year, wind speeds in Chilanga average from 2 m/s (4 knots) and increase to 4 m/s (8 knots).
In January, February, March and December you will experiences an 2 m/s (4 knots) average wind speed, creating pleasant light breeze conditions. Daily variations include nearly windless periods alternating with moderate breezes on some days. When winds reach the 2 m/s (4 knots) average, you'll notice a soft touch of air movement and gentle leaf motion. This translates to approximately 7.2 kilometers per hour or 4.5 miles per hour. This level of wind is typically not disruptive, making it comfortable to be outside most days.
Wind speeds reach an average of 4 m/s (8 knots) in July, August, September and October; this is the windiest time of the year. This means that on some days, the air is a strong breeze. There may still be stronger gusts or calmer moments, but windy conditions are the norm during this month.
For more detailed information about Chilanga’s weather, including monthly rainfall, sunshine hours, and humidity levels, visit our Chilanga climate page.