Chelston Weather & Climate: Best Time to Visit
Average temperatures, rainfall, sunshine and the best time to visit Chelston.
Climate overview of Chelston
Chelston, Zambia, experiences moderate temperature changes through the seasons. October is the warmest month with daytime highs of 33°C (91°F), while July is the coolest at 24°C (75°F).
With around 1014 mm (40 in) of annual rainfall, Chelston has a notably wet climate. However, this rainfall is not evenly distributed — the city has distinct dry (April to October) and wet (December to February) seasons. The wettest month is January. The sunniest month is August, with 10.2 hours of sunshine per day on average.
Chelston Weather by Month
Pick a month to see the average temperature, rainfall and sunshine in Chelston — and find the best time to visit.
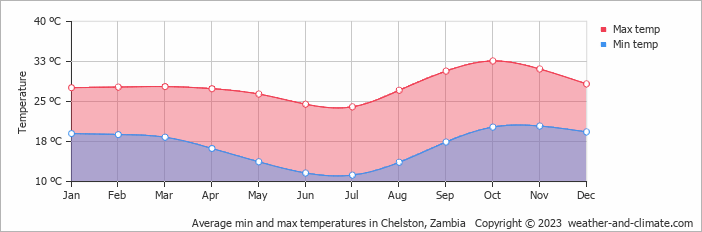
Monthly Temperature in Chelston
In Chelston, seasonal changes bring about a moderate variation in temperatures. Average daytime temperatures reach a very warm 33°C (91°F) in October. In July, the coolest month of the year, temperatures drop to a comfortable 24°C (75°F).
At night, temperatures range from around 20°C (68°F) in October to 11°C (52°F) in July.
Check out our detailed temperature page for more information.
Temperature ranges by month
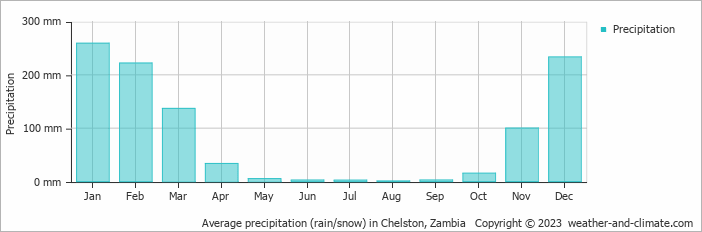
Rainfall in Chelston
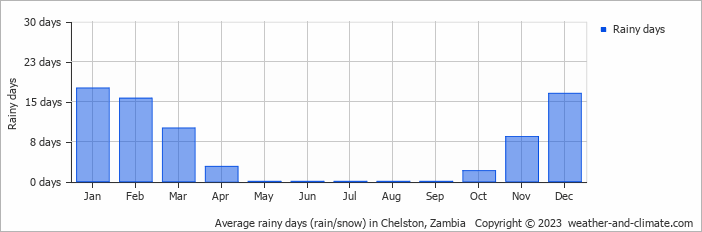
Chelston has a relatively rainy climate with high precipitation levels, averaging 1014 mm (40 in) of rainfall annually. Chelston can be quite wet during January, receiving approximately 259 mm (10 in) of precipitation over 18 rainy days.
In contrast, during the driest month (August), you will experience much drier conditions, with 0.9 mm (0.04 in) of precipitation spread across 0 rainy days days. For more details, please visit our Chelston Precipitation page.
The mean monthly precipitation over the year, including rain, hail, and snow
The average number of days each month with precipitation
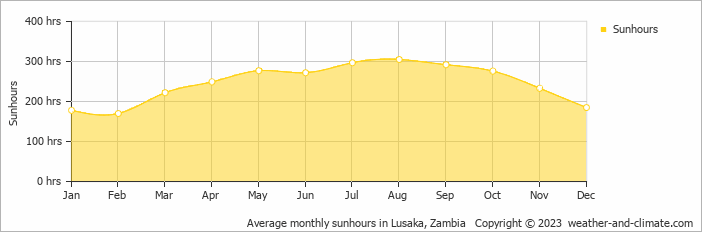
Sunshine Hours in Chelston
Chelston can be enjoyed more throughout the sunniest month of August under a blue sky, with approximately 10.2 hours of sunshine daily. In contrast, the city experiences much darker days in February, with only 5.7 hours of sunlight per day.
Visit our detailed sunshine hours page for more information.
Monthly hours of sunshine
Daily hours of sunshine
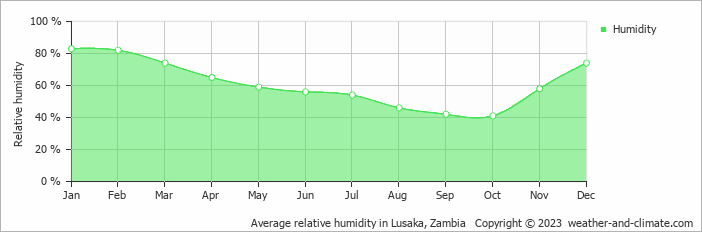
Humidity in Chelston by Month
The relative humidity is high throughout the year in Chelston.
The city experiences its highest humidity in January, reaching 83%. In October, the humidity drops to its lowest level at 41%. What does this mean? Read our detailed page on humidity levels for further details.
Relative humidity over the year
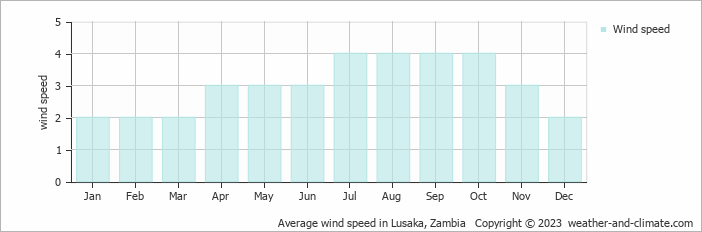
Wind Speed in Chelston
The average wind speed over the year ranges from 2 m/s (4 knots) to 4 m/s (8 knots). It is lower in January, February, March and December and higher in July, August, September and October. What does this mean?
The mean monthly wind speed over the year (meters per second)
Best Time to Visit Chelston
Rainfall during this time ranges from 1 mm (0.04 in) in August to 137 mm (5.4 in) in March. This means you can expect a mix of sunny days and occasional showers.
The rainy season falls during January, February and December, bringing heavy precipitation. Ready to plan your travels but need destination ideas? Our smart tool recommends places based on the climate conditions you prefer. Start planning with our destination weather tool.
Frequently asked questions about the climate in Chelston
What is the best time to visit Chelston?
April, May, June, July and August typically offer the most optimal weather in Chelston. In contrast, January, February, November and December tend to have less optimal conditions. Chelston has distinct dry (April to October) and wet (December to February) seasons.
What temperatures can I expect in Chelston?
Daytime highs range from 24°C (75°F) in July to 33°C (91°F) in October. Nighttime lows range from 11°C (52°F) to 20°C (68°F).
How much rain does Chelston get?
Annual rainfall is around 1014 mm (40 in). January is the wettest month with 259 mm (10 in), while August is the driest with 0.9 mm (0.04 in).
How sunny is Chelston?
Chelston receives around 2,956 hours of sunshine per year. August is the sunniest month with 305 hours, while February is the cloudiest with just 170 hours. Overall, Chelston enjoys abundant sunshine.
Chelston 3-Day Forecast
Chelston 3-Day Forecast
Chelston on the map
Chelston is highlighted — select any city to see its climate.
Popular this month
Where to go in July — average daytime high across popular destinations.
Bucket list
Need travel inspiration? Check out our bucket list articles and be inspired.
 The world famous Victoria Falls in Zambia
The world famous Victoria Falls is one of the 7 natural wonders of the world for a reason. It is absolutely magnificent to see.
 5 Untouched Safari Destinations in Africa
Discover Africa's hidden national parks, from Zambia's Liuwa Plain to Zimbabwe's Matusadona, offering unique wildlife experiences off the beaten path.