Cherni Vit Weather & Climate: Best Time to Visit
Average temperatures, rainfall, sunshine and the best time to visit Cherni Vit.
Climate overview of Cherni Vit
Cherni Vit, Lovech, Bulgaria, experiences significant temperature variation throughout the year. Summers bring daytime highs of 27°C (81°F) in August, while winters cool to 4°C (39°F) in January.
The city receives around 945 mm (37 in) of rain/snowfall per year. May is the wettest month and November the driest.
Cherni Vit Weather by Month
Pick a month to see the average temperature, rainfall and sunshine in Cherni Vit — and find the best time to visit.
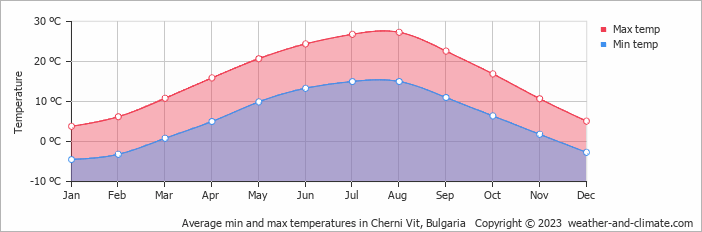
Monthly Temperature in Cherni Vit
Depending on the time of the year, temperatures range from comfortable to chilly in Cherni Vit. On average, daytime temperatures range from a comfortable 27°C (81°F) in August to a chilly 4°C (39°F) in January.
Nighttime temperatures range from 15°C (59°F) in August to -5°C (23°F) in January.
Check out our detailed temperature page for more information.
Temperature ranges by month
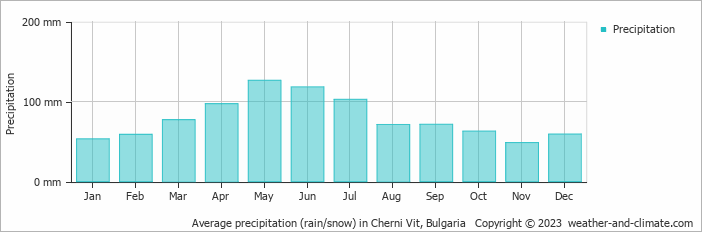
Rainfall in Cherni Vit
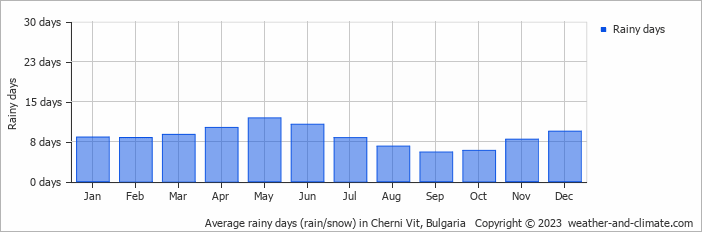
Generally, Cherni Vit has a moderate amount of precipitation, averaging 945 mm (37 in) of rain/snowfall annually. The seasons in Cherni Vit bring significant changes in precipitation. The wettest month, May, receives high rainfall, with an average of 126 mm (5 in) of precipitation. This rainfall is distributed across 12 rainy days.
In contrast, the driest month, November, experiences much less rainfall, totaling 48 mm (1.9 in) over 8 rainy days. These distinct seasonal differences provide diverse experiences throughout the year. For more details, please visit our Cherni Vit Precipitation page.
The mean monthly precipitation over the year, including rain, hail, and snow
The average number of days each month with precipitation
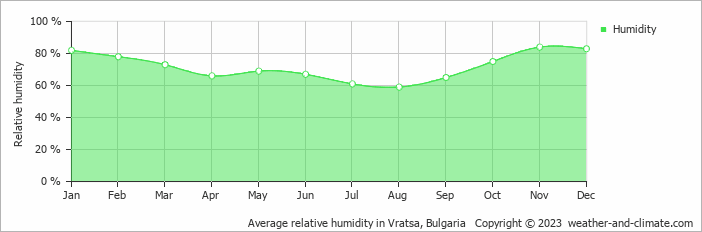
Humidity in Cherni Vit by Month
The relative humidity is high throughout the year in Cherni Vit.
The city experiences its highest humidity in November, reaching 84%. In August, the humidity drops to its lowest level at 59%. What does this mean? Read our detailed page on humidity levels for further details.
Relative humidity over the year
Best Time to Visit Cherni Vit
Rainfall during this time ranges from 71 mm (2.8 in) in August to 126 mm (5 in) in May. This means you can expect a mix of sunny days and occasional showers. Seeking the perfect travel destination for this year? We've created a tool that suggests locations matching your desired weather. Let our weather planner guide your travel decisions.
Frequently asked questions about the climate in Cherni Vit
What is the best time to visit Cherni Vit?
August and September typically offer the most optimal weather in Cherni Vit. In contrast, January, February and December tend to have less optimal conditions.
What temperatures can I expect in Cherni Vit?
Daytime highs range from 4°C (39°F) in January to 27°C (81°F) in August. Nighttime lows range from -5°C (23°F) to 15°C (59°F). Temperatures vary considerably through the year.
How much rain does Cherni Vit get?
Annual rainfall is around 945 mm (37 in). May is the wettest month with 126 mm (5 in), while November is the driest with 48 mm (1.9 in).
Cherni Vit 3-Day Forecast
Cherni Vit 3-Day Forecast
Cherni Vit on the map
Cherni Vit is highlighted — select any city to see its climate.
Popular this month
Where to go in July — average daytime high across popular destinations.
Bucket list
Need travel inspiration? Check out our bucket list articles and be inspired.
 7 of the most budget-friendly destinations in Europe
Discover Europe's top budget-friendly destinations including Budapest, Kotor, Krakow, and more, perfect for affordable and exciting travel.
 Meadows in the mountains
Meadows in the mountains is a world away from large line-ups and huge crowds. High in the Rhodope Mountains in Bulgaria.
 Cycle the Danube trail
The Danube cycle route is one of the most popular cycling routes in Europe, and rightly so, because it is a varied route that is interesting both in terms of culture and nature.