














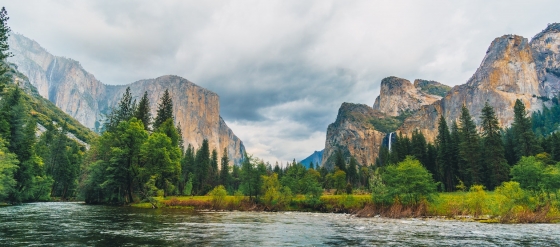
 Yosemite National Park is definitely worth a visit
Vast forests, blue lakes, towering sequoias, and majestic waterfalls hint at the beauty of Yosemite National Park—a true natural masterpiece.
Average temperatures, rainfall, sunshine and the best time to visit Chatsworth.
 –
–
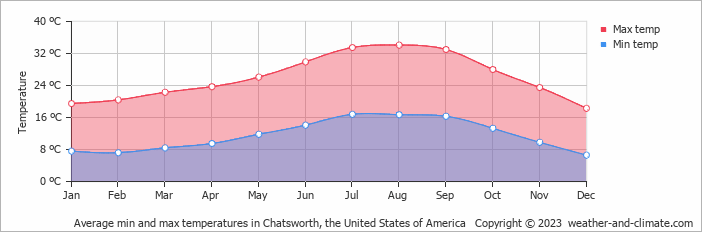
The climate in Chatsworth, California, United States of America, is marked by large temperature swings across the seasons, ranging from 34°C (93°F) in August to 18°C (64°F) in December.
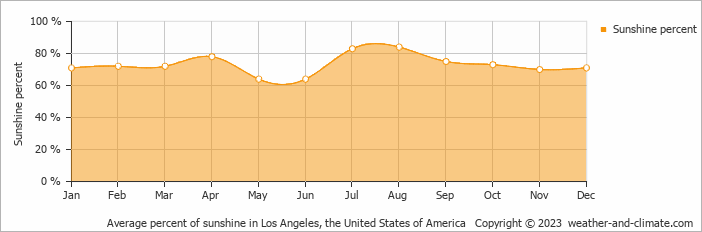
The city has a relatively dry climate, receiving around 303 mm (12 in) of rainfall per year. It does experience a distinct dry season from April to November, with very warm summers and pleasant winters. December is the wettest month and August the driest. Sunshine peaks in July, when the city sees around 12.1 hours of sunshine per day.
Pick a month to see the average temperature, rainfall and sunshine in Chatsworth - and find the best time to visit.
In Chatsworth, temperatures differ significantly between summer and winter months. On average, daytime temperatures range from a very warm 34°C (93°F) in August to a pleasant 18°C (64°F) in December.
Nighttime temperatures range from 17°C (63°F) in August to 7°C (45°F) in December.
Check out our detailed temperature page for more information.
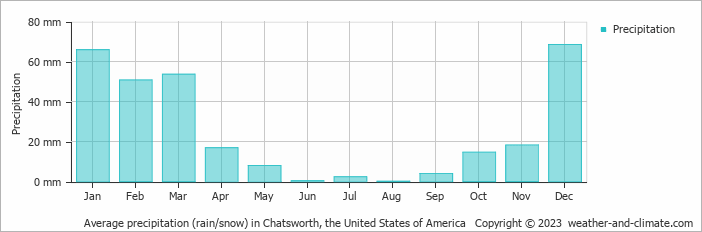
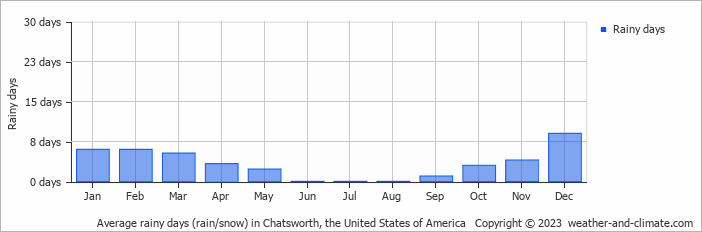
Chatsworth tends toward drier weather patterns, receiving approximately 303 mm (12 in) of rain per year. The seasons in Chatsworth bring significant changes in precipitation. The wettest month, December, receives moderate rainfall, with an average of 68 mm (2.7 in) of precipitation. This rainfall is distributed across 9 rainy days.
In contrast, the driest month, August, experiences much less rainfall, totaling 0.1 mm (0 in) over 0 rainy days. These distinct seasonal differences provide diverse experiences throughout the year. For more details, please visit our Chatsworth Precipitation page.
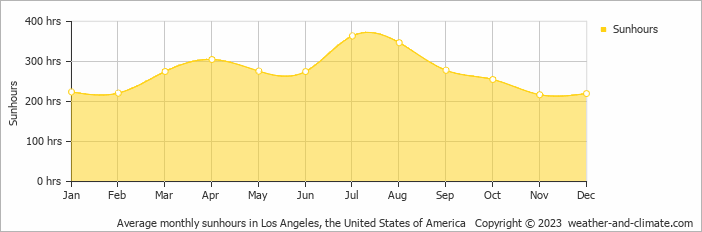
In Chatsworth, summer days are longer and more sunny, with daily sunshine hours peaking at 12.1 hours in July. As the darker season arrives, the brightness of the sun becomes less. November sees a soft sun for only 7.2 hours per average day.
Visit our detailed sunshine hours page for more information.
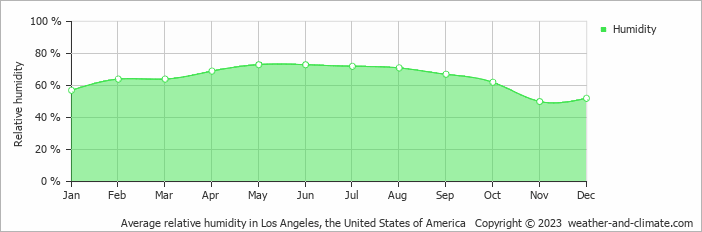
The relative humidity is high throughout the year in Chatsworth.
The city experiences its highest humidity in May, reaching 73%. In November, the humidity drops to its lowest level at 50%. What does this mean? Read our detailed page on humidity levels for further details.
Monthly ratings reflect general weather comfort, based on daytime temperature and rainfall. Swimming and winter conditions are highlighted separately where relevant.
January, February, March, April, May, October and November typically offer the most optimal weather in Chatsworth. In contrast, July and August tend to have less optimal conditions. Chatsworth has a distinct dry season from April to November, with very warm summers and pleasant winters.
Daytime highs range from 18°C (64°F) in December to 34°C (93°F) in August. Nighttime lows range from 7°C (45°F) to 17°C (63°F). Temperatures vary considerably through the year.
Annual rainfall is around 303 mm (12 in). December is the wettest month with 68 mm (2.7 in), while August is the driest with 0.1 mm (0 in).
Chatsworth receives around 3,257 hours of sunshine per year. July is the sunniest month with 364 hours, while November is the cloudiest with just 217 hours. Overall, Chatsworth enjoys abundant sunshine.
Chatsworth is highlighted - select any city to see its climate.
Where to go in October - average daytime high across popular destinations.
Miami Beach 29°C (84°F) Orlando29°C (84°F) Kissimmee
 29°C (84°F) Destin26°C (79°F) Los Angeles24°C (75°F) New York City19°C (66°F) Big Bear Lake19°C (66°F)
 Need travel inspiration? Check out our bucket list articles and be inspired.
Yosemite National Park is definitely worth a visit
Vast forests, blue lakes, towering sequoias, and majestic waterfalls hint at the beauty of Yosemite National Park—a true natural masterpiece.
 The 10 most alternative cities in the United States
Discover the top 10 fun and alternative U.S. cities rich in art, culture, and adventure. From Portland's hippy charm to Sedona's stunning landscapes.
 Sedona: Explore Majestic Red Rock Landscapes
A picturesque artists' town surrounded by red rocks and known for its spirituality, vortex energy, and stunning hikes like Cathedral Rock.
 10 most idyllic villages to visit in the United States
Discover 10 idyllic villages in the USA, from California to Vermont. Explore their unique charm, rich history, stunning nature, and vibrant arts scenes.