Captain Cook (HI) Weather & Climate: Best Time to Visit
Average temperatures, rainfall, sunshine and the best time to visit Captain Cook.
Climate overview of Captain Cook
Captain Cook, Hawaii, United States of America, enjoys a steady climate throughout the year, with daytime temperatures typically around 23°C (73°F). August is the warmest month at 24°C (75°F), while February is the coolest at 21°C (70°F).
The city has a wet climate, receiving around 4774 mm (188 in) of rainfall per year. July is the wettest month. The most sunshine falls in June, with an average of 9.7 hours of daily sunshine.
Captain Cook Weather by Month
Pick a month to see the average temperature, rainfall and sunshine in Captain Cook - and find the best time to visit.
Monthly Temperature in Captain Cook
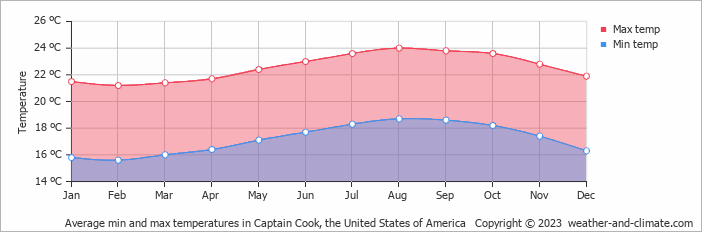
The temperature in Captain Cook remains steady throughout the year, providing a consistently comfortable climate. On average, daytime temperatures range from a comfortable 24°C (75°F) in August to a pleasant 21°C (70°F) in February.
Nighttime temperatures range from 19°C (66°F) in August to 16°C (61°F) in February.
Check out our detailed temperature page for more information.
Temperature ranges by month
Rainfall in Captain Cook
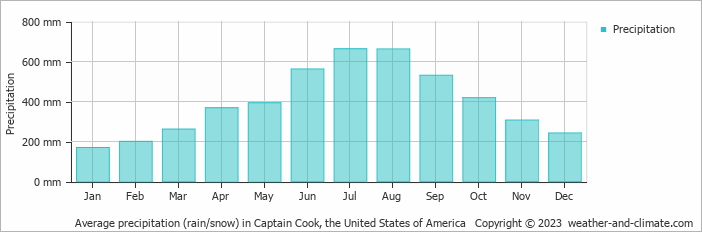
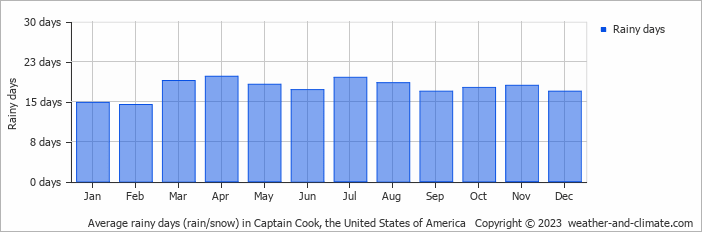
Captain Cook has a relatively rainy climate with high precipitation levels, averaging 4774 mm (188 in) of rainfall annually. The seasons in Captain Cook bring significant changes in precipitation. The wettest month, July, receives heavy rainfall, with an average of 663 mm (26 in) of precipitation. This rainfall is distributed across 20 rainy days.
In contrast, the driest month, January, experiences much less rainfall, totaling 169 mm (6.7 in) over 15 rainy days. These distinct seasonal differences provide diverse experiences throughout the year. For more details, please visit our Captain Cook Precipitation page.
The mean monthly precipitation over the year, including rain, hail, and snow
The average number of days each month with precipitation
Sunshine Hours in Captain Cook
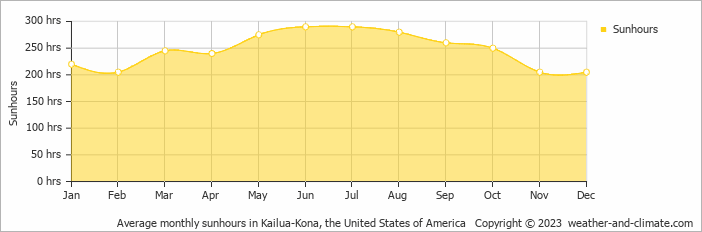
Captain Cook enjoys sunny spells year-round. June sees up to 9.7 hours of daily sunshine, perfect for a sunny trip. February, the least sunny month, still offers a generous 6.8 hours of sun despite this cloudier time of the year.
Visit our detailed sunshine hours page for more information.
Monthly hours of sunshine
Daily hours of sunshine
Best Time to Visit Captain Cook
Each month is rated for comfortable sightseeing weather — mild temperatures and low rainfall. Tap a month for its full averages; your ideal time may differ for a beach or winter trip (see below).
- Best overall: January
- Warmest weather: June, July, August, September, October and November
- Most sunshine: June, July and August
Frequently asked questions about the climate in Captain Cook
What is the best time to visit Captain Cook?
January typically offers the most optimal weather in Captain Cook. In contrast, March, April, May, June, July, August, September, October and November tend to have less optimal conditions.
What temperatures can I expect in Captain Cook?
Daytime highs range from 21°C (70°F) in February to 24°C (75°F) in August. Nighttime lows range from 16°C (61°F) to 19°C (66°F). Temperatures stay relatively stable year-round.
How much rain does Captain Cook get?
Annual rainfall is around 4774 mm (188 in). July is the wettest month with 663 mm (26 in), while January is the driest with 169 mm (6.7 in).
How sunny is Captain Cook?
Captain Cook receives around 2,965 hours of sunshine per year. June is the sunniest month with 290 hours, while February is the cloudiest with just 205 hours. Overall, Captain Cook enjoys abundant sunshine.
Captain Cook 3-Day Forecast
Captain Cook (HI) 3-Day Forecast
Captain Cook on the map
Captain Cook is highlighted - select any city to see its climate.
Popular this month
Where to go in July - average daytime high across popular destinations.
Bucket list
Need travel inspiration? Check out our bucket list articles and be inspired.
 Yosemite National Park is definitely worth a visit
Vast forests, blue lakes, towering sequoias, and majestic waterfalls hint at the beauty of Yosemite National Park—a true natural masterpiece.
The 10 most alternative cities in the United States
Discover the top 10 fun and alternative U.S. cities rich in art, culture, and adventure. From Portland's hippy charm to Sedona's stunning landscapes.
Sedona: Explore Majestic Red Rock Landscapes
A picturesque artists' town surrounded by red rocks and known for its spirituality, vortex energy, and stunning hikes like Cathedral Rock.
10 most idyllic villages to visit in the United States
Discover 10 idyllic villages in the USA, from California to Vermont. Explore their unique charm, rich history, stunning nature, and vibrant arts scenes.