Monthly Average Rainy days in Captain Cook (HI)
The number of days each month with rain, snow and hail in Captain Cook (Hawaii), the United States of America.
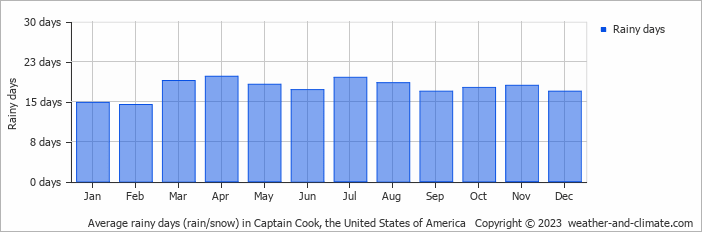
- Most rainy days are in March, April, May, June, July, August, September, October, November and December.
- On average, April is the most rainy with 19 days of rain/snow.
- On average, February is the driest month with 14 rainy days.
- The average annual number of rainy days is 210.
Current rainfall in Captain Cook (HI)
Sun Dec 22
25°C | 16°C
NW  3 m/s
3 m/s
3 m/s1 mm
broken clouds and small chance of rain
Mon Dec 23
26°C | 17°C
S 2 m/s
2 m/salmost clear and no rain
Tue Dec 24
27°C | 17°C
W 2 m/s
2 m/salmost clear and no rain


