Boca del Río Weather & Climate: Best Time to Visit
Average temperatures, rainfall, sunshine and the best time to visit Boca del Río.
Climate overview of Boca del Río
With consistently stable weather, Boca del Río, Veracruz, Mexico, sees little seasonal temperature change. Daytime highs average 30°C (86°F), ranging from 32°C (90°F) in May to 26°C (79°F) in January.
Rainfall is high, totalling around 1412 mm (56 in) per year. September is the wettest month and March the driest. The city also experiences distinct dry (December to April) and wet (June to September) seasons. The most sunshine falls in August, with an average of 7.4 hours of daily sunshine.
Boca del Río Weather by Month
Pick a month to see the average temperature, rainfall and sunshine in Boca del Río — and find the best time to visit.
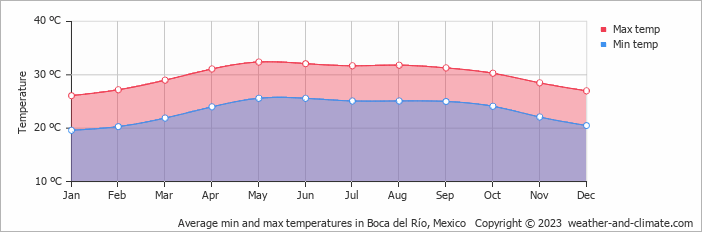
Monthly Temperature in Boca del Río
The climate in Boca del Río remains fairly constant, offering comfortable temperatures throughout the year. Average maximum daytime temperatures range from a very warm 32°C (90°F) in May, the warmest time of the year, to a comfortable 26°C (79°F) during cooler months like January.
At night, you can expect temperatures ranging from 26°C (79°F) in May to around 20°C (68°F) during January.
Check out our detailed temperature page for more information.
Temperature ranges by month
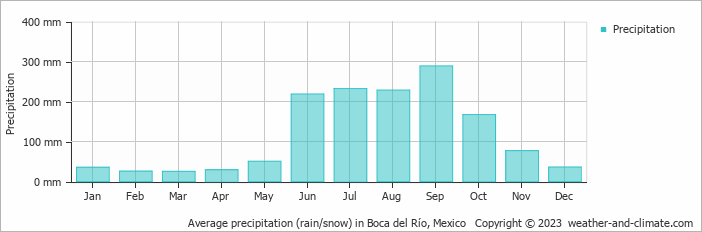
Rainfall in Boca del Río
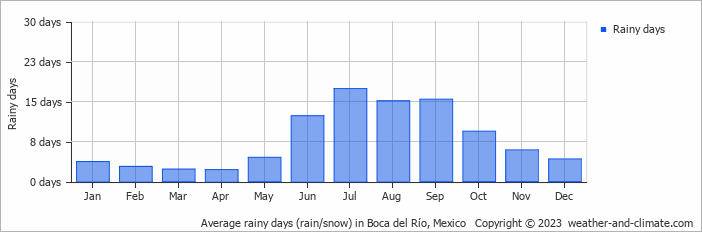
Boca del Río is known for its substantial rainfall, with annual precipitation reaching 1412 mm (56 in). Significant seasonal changes in precipitation occur throughout the year. In the wettest month, September it receives heavy rainfall, averaging 289 mm (11 in) of precipitation, recorded across 15 rainy days. In contrast, the driest month March brings less rainfall, with 25 mm (1 in) over 2 rainy days. For more details, please visit our Boca del Río Precipitation page.
The mean monthly precipitation over the year, including rain, hail, and snow
The average number of days each month with precipitation
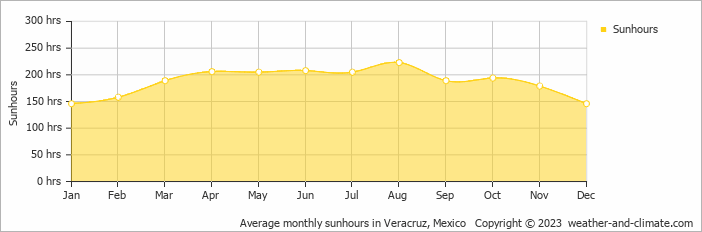
Sunshine Hours in Boca del Río
While the amount of sunshine in Boca del Río varies throughout the year, all seasons offer their own charm. Enjoy up to 7.4 hours of daily sun in August, and experience slightly darker atmosphere in January, with about 4.9 hours of daily sunlight.
Visit our detailed sunshine hours page for more information.
Monthly hours of sunshine
Daily hours of sunshine
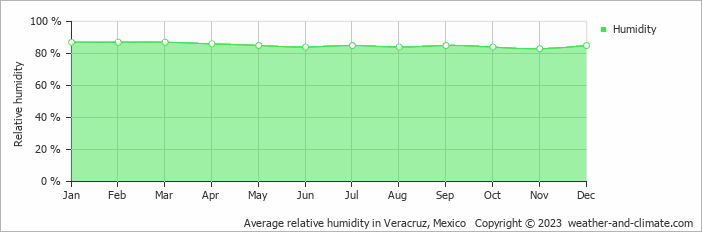
Humidity in Boca del Río by Month
The city experiences its highest humidity in January, reaching 87%. In November, the humidity drops to its lowest level at 83%. What does this mean? Read our detailed page on humidity levels for further details.
Relative humidity over the year
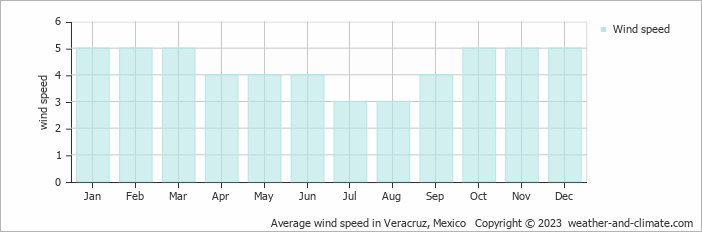
Wind Speed in Boca del Río
The average wind speed over the year ranges from 3 m/s (6 knots) to 5 m/s (10 knots). It is lower in July and August and higher in January, February, March, October, November and December. What does this mean?
The mean monthly wind speed over the year (meters per second)
Best Time to Visit Boca del Río
Make your experience more enjoyable by planning to be outside during the cooler parts of the day, either early morning or as the sun begins to set. Visitors should note that June, July, August, September and October are part of the rainy season, bringing substantial rainfall. Seeking the perfect travel destination for this year? We've created a tool that suggests locations matching your desired weather. Let our weather planner guide your travel decisions.
Frequently asked questions about the climate in Boca del Río
What is the best time to visit Boca del Río?
January, February, March, November and December typically offer the most optimal weather in Boca del Río. In contrast, June, July, August and September tend to have less optimal conditions. Boca del Río has distinct dry (December to April) and wet (June to September) seasons.
What temperatures can I expect in Boca del Río?
Daytime highs range from 26°C (79°F) in January to 32°C (90°F) in May. Nighttime lows range from 20°C (68°F) to 26°C (79°F). Temperatures stay relatively stable year-round.
How much rain does Boca del Río get?
Annual rainfall is around 1412 mm (56 in). September is the wettest month with 289 mm (11 in), while March is the driest with 25 mm (1 in).
How sunny is Boca del Río?
Boca del Río receives around 2,248 hours of sunshine per year. August is the sunniest month with 223 hours, while January is the cloudiest with just 146 hours. Overall, Boca del Río enjoys abundant sunshine.
Boca del Río 3-Day Forecast
Boca del Río 3-Day Forecast
Boca del Río on the map
Boca del Río is highlighted — select any city to see its climate.
Popular this month
Where to go in July — average daytime high across popular destinations.
Bucket list
Need travel inspiration? Check out our bucket list articles and be inspired.
 Explore the Majestic Copper Canyons of Mexico
Explore the vast Copper Canyons in Chihuahua, Mexico—larger than the Grand Canyon. Discover scenic train rides, hikes, and the Tarahumara people.
These are the most beautiful Mayan ruins and Mayan temples in Mexico
Mexico is a destination where you can immerse yourself in ancient cultures and civilizations. In this article we have listed our favorite Mayan ruins.
Tips, to-do's and nicest restaurants in Mexico City
Mexico City, one of the most famous and notorious cities of the world. The best time to visit is between March and May, but it can be visited year round.
Zihuatanejo: A Pacific paradise with beautiful beaches
Zihuatanejo has some of Mexico's top beaches. Unlike other off-the-beaten-path destinations in Mexico, Zihua is very accessible and sustainable.