Los Glaciares National Park Weather & Climate: Best Time to Visit
Average temperatures, rainfall, sunshine and the best time to visit Los Glaciares National Park.
Climate overview of Los Glaciares National Park
Los Glaciares National Park, Argentina, has a moderate seasonal temperature range, with February reaching 10°C (50°F) and July cooling to 1°C (34°F).
The city receives considerable rain/snowfall, with around 3280 mm (129 in) annually. December is the wettest month. The sunniest month is January, with 8.7 hours of sunshine per day on average.
Los Glaciares National Park Weather by Month
Pick a month to see the average temperature, rainfall and sunshine in Los Glaciares National Park - and find the best time to visit.
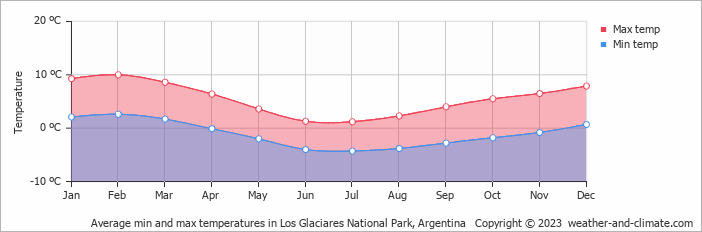
Monthly Temperature in Los Glaciares National Park
The climate in Los Glaciares National Park experiences moderate temperature changes, with mild shifts between seasons. Typically, average maximum daytime temperatures range from a chilly 10°C (50°F) in February to a very cold 1°C (34°F) in the coolest month, July.
Nights vary from 3°C (37°F) in February to around -4°C (25°F) during the colder months.
Check out our detailed temperature page for more information.
Temperature ranges by month
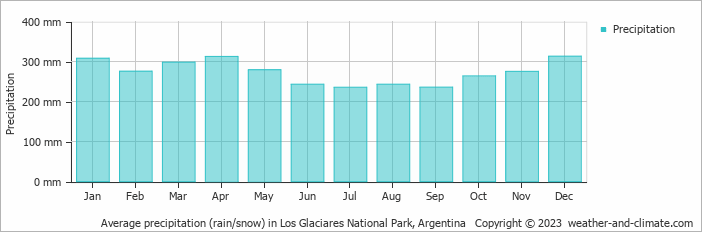
Rainfall in Los Glaciares National Park
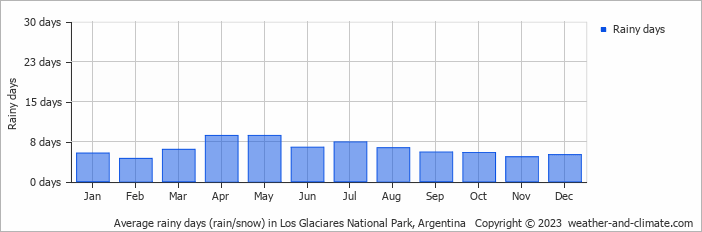
Los Glaciares National Park is known for its substantial rain/snowfall, with annual precipitation reaching 3280 mm (129 in). Precipitation levels in Los Glaciares National Park remain relatively steady throughout the year. December has the most rain, with 313 mm (12 in) over 5 days. In the driest month July, this drops slightly to 235 mm (9.3 in), making the city's climate fairly predictable. For more details, please visit our Los Glaciares National Park Precipitation page.
The mean monthly precipitation over the year, including rain, hail, and snow
The average number of days each month with precipitation
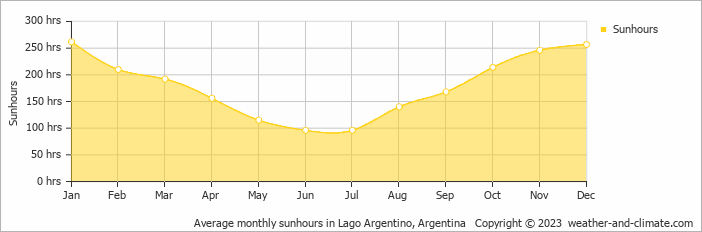
Sunshine Hours in Los Glaciares National Park
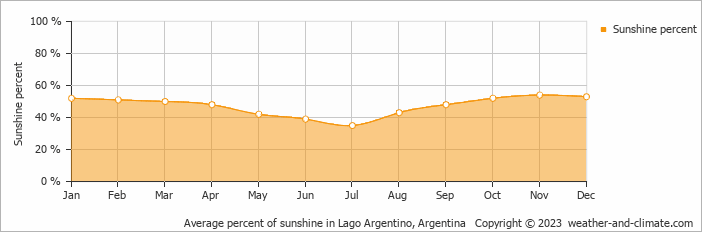
For those who appreciate different seasons, Los Glaciares National Park serves as an ideal destination. Expect longer, more sun-filled days in January with an average of 8.7 hours of sunshine daily, and embrace the darker days in June, offering only 3.2 hours of daily sunlight.
Visit our detailed sunshine hours page for more information.
Monthly hours of sunshine
Daily hours of sunshine
Daily percentage of sunshine
Humidity in Los Glaciares National Park by Month
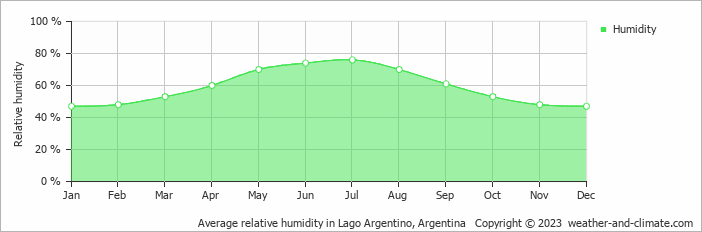
The relative humidity is moderate throughout the year in Los Glaciares National Park.
The city experiences its highest humidity in July, reaching 76%. In January, the humidity drops to its lowest level at 47%. What does this mean? Read our detailed page on humidity levels for further details.
Relative humidity over the year
Best Time to Visit Los Glaciares National Park
Monthly ratings reflect general weather comfort, based on daytime temperature and rainfall. Swimming and winter conditions are highlighted separately where relevant.
- Warmest weather: January, February and March
- Most sunshine: January and December
- Coldest conditions: July, with freezing nights around -4°C (25°F).
Frequently asked questions about the climate in Los Glaciares National Park
What temperatures can I expect in Los Glaciares National Park?
Daytime highs range from 1°C (34°F) in July to 10°C (50°F) in February. Nighttime lows range from -4°C (25°F) to 3°C (37°F).
How much rain does Los Glaciares National Park get?
Annual rainfall is around 3280 mm (129 in). December is the wettest month with 313 mm (12 in), while July is the driest with 235 mm (9.3 in).
How sunny is Los Glaciares National Park?
Los Glaciares National Park receives around 2,152 hours of sunshine per year. January is the sunniest month with 262 hours, while June is the cloudiest with just 96 hours. Overall, Los Glaciares National Park enjoys abundant sunshine.
Los Glaciares National Park 3-Day Forecast
Los Glaciares National Park 3-Day Forecast
Los Glaciares National Park on the map
Los Glaciares National Park is highlighted - select any city to see its climate.
Popular this month
Where to go in July - average daytime high across popular destinations.
Bucket list
Need travel inspiration? Check out our bucket list articles and be inspired.
 Glacier walk on The Perito Moreno glacier
The Perito Moreno glacier and the rupture of this glacier is considered one of the most impressive natural spectacles in the world. You can wait here until a large piece of ice crumbles and plunges into the water with a lot of noise.
Be amazed by Buenos Aires
The city of beautiful museums, cute streets, green parks, lots of good food, interesting local neighborhoods and impressive historical buildings.
Explore Patagonia
A tour through Patagonia brings you to the end of the world. That’s why Patagonia is a bucket list destination for many. We recommend to visit Patagonia from November to early March.
Glacier walk on The Perito Moreno glacier
The Perito Moreno glacier and the rupture of this glacier is considered one of the most impressive natural spectacles in the world. You can wait here until a large piece of ice crumbles and plunges into the water with a lot of noise.