Los Glaciares National Park Monthly Rainfall & Precipitation
This page shows both the average monthly rainfall and the number of rainy days in Los Glaciares National Park, Argentina. The figures are based on a 30-year period (1990–2020) to provide a reliable average. Now, let's break down all the details for a clearer picture.
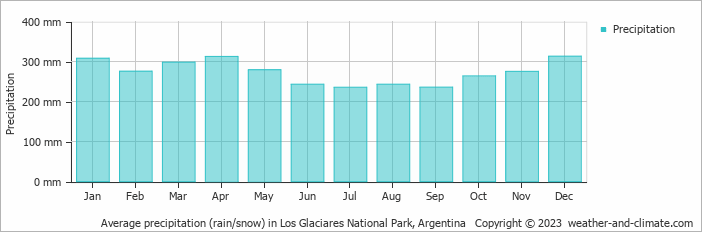
Los Glaciares National Park is known for its substantial rain/snowfall, with annual precipitation reaching 3280 mm (129 in).
Monthly Precipitation Levels
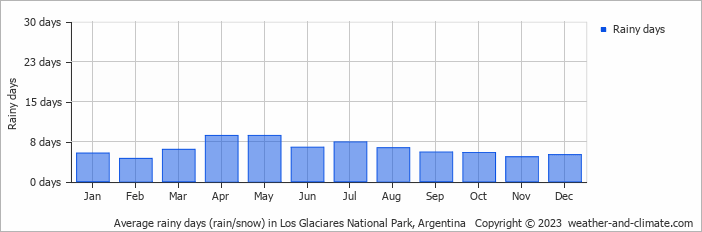
The average number of days each month with precipitation (> 0.2 mm (0.01 in))
The wettest period in Los Glaciares National Park occurs in December, which receives around 313 mm (12 in) of precipitation. During the driest month, July, Los Glaciares National Park experiences heavy snow/rainfall, totaling approximately 235 mm (9.3 in). The consistent precipitation levels throughout the year contribute to a relatively stable climate.
December, the wettest month, has a maximum daytime temperature of 8°C (46°F). The city receives 257 hours of sunshine in this period. During the driest month July you can expect a temperature of 1°C (34°F). For more detailed insights into the city's temperatures, visit our Los Glaciares National Park Temperature page.
Explore Los Glaciares National Park's Historical Precipitation: 1976-2026
Browse day-by-day precipitation records for Los Glaciares National Park spanning 51 years. Select any month and year to see actual rainfall and snowfall recorded on each day.
Annual Rainfall in Argentina: City Comparison
The map below shows the annual precipitation across Argentina. You can also select the different months in case you are interested in a specific month.
 heavy rainfall
 high
high
 moderate
 low
low
 almost none
Los Glaciares National Park vs World: Rainfall Compared
Los Glaciares National Park's average annual precipitation is 3280 mm (129 in). Let's compare this to some popular worldwide tourist destinations:
The city of Rome, Italy, has an average annual precipitation of 832 mm (33 in), spread fairly evenly throughout the year.
In Shanghai, China, the annual average precipitation is 1347 mm (53 in), with a humid subtropical climate.
In Tokyo, Japan, the average annual precipitation is 1528 mm (60 in), with significant summer rains due to typhoon season.
Singapore, situated near the equator, gets 2581 mm (102 in) of rainfall annually, with no distinct dry season and consistent monthly precipitation.
Precipitation amounts are measured using specific gauges installed at weather stations, collecting both rain and snow and any other type of precipitation. Rainfall is measured directly in millimeters, while that from snow and ice is obtained by melting it. Automated systems often incorporate heaters to make this easier.
Information from these stations is transmitted via Wi-Fi, satellite, GPS, or telephone connections to central monitoring networks. This information is immediately updated and integrated into weather models and forecasts.
- Mawsynram in India is noted as being the wettest place on earth, with over 11 meters (36 feet) of rain falling every year.
- In contrast, Antofagasta in Chile is among the driest places on the planet, getting less than 0.1mm (0.004 inches) per year, with some years recording virtually no rainfall.
- Nearly 1,650 thunderstorm cells are estimated over the planet at any given time.
For more detailed information about Los Glaciares National Park's weather, including sunshine hours, humidity levels, and temperature data, visit our Los Glaciares National Park Climate page.


