


















 Warm Sea Without Extreme Heat: 8 Beach Destinations With Comfortable Weather
Love warm seawater but not extreme heat? Compare eight beach destinations where the sea stays warm while daytime temperatures remain comfortable.
On this page you find more information about the monthly relative humidity over the year in Cala Millor (the Balearic Islands), Spain.

Cala Millor's humidity levels vary throughout the year. The highest levels occur in January, reaching 78% (high), while the lowest is recorded in July at 75%.
Throughout the year, the average humidity in Cala Millor is 77%.
Humidity plays an important role in how temperatures are felt. During the warmest month, August, the maximum average temperature is around 29°C (84°F). Combined with high humidity during this period, the temperature can feel even warmer than the thermometer shows.
During the coldest month, February, the maximum average temperature is around 16°C (61°F). This period has high humidity. Check out our detailed temperature page for more information.
Pick a month to see the average temperature, rainfall and sunshine in Cala Millor - and find the best time to visit.
Temperature Rainfall Sunshine Humidity
See the full Cala Millor climate overview or explore weather in Spain.
Where to go in October - average daytime high across popular destinations.
Need travel inspiration? Check out our bucket list articles and be inspired.
Warm Sea Without Extreme Heat: 8 Beach Destinations With Comfortable Weather
Love warm seawater but not extreme heat? Compare eight beach destinations where the sea stays warm while daytime temperatures remain comfortable.

 El Hierro: The smallest Canary island without mass tourism
Mainly nature lovers and those seeking tranquility go to El Hierro. The island is know for its beautiful mountains and you can wonder around for days here.
 Spain in October: Where Is It Warmest and Sunniest?
Discover where Spain is warmest in October, with climate comparisons for Seville, Alicante, Málaga, Tenerife, Madrid and Barcelona.
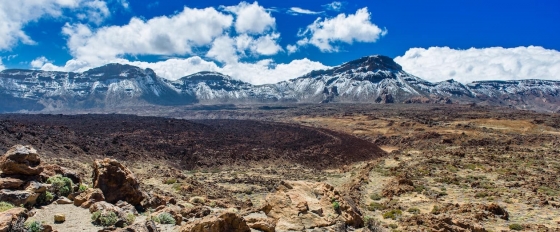 Visit national Park El Teide
This national park is truly a unique place that you should not miss. You will find landscapes that seem to come from another plane and you will feel tiny in these impressive surroundings.