
















 An alternative way to discover Sydney
We have made an overview of the sights in Sydney that you must see if you want to visit Sydney in an alternative way.
On this page you find more information about the monthly relative humidity over the year in Bargara (Queensland), Australia.
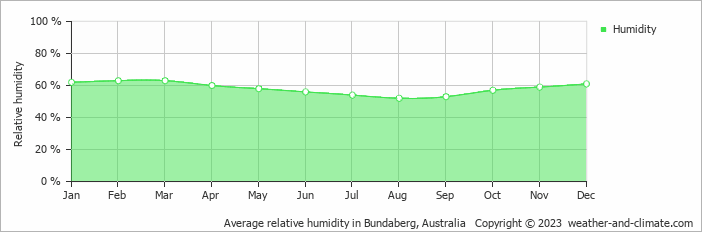
Bargara's humidity levels vary throughout the year. The highest levels occur in February, reaching 63% (high), while the lowest is recorded in August at 52%.
Throughout the year, the average humidity in Bargara is 58%.
Humidity plays an important role in how temperatures are felt. During the warmest month, January, the maximum average temperature is around 29°C (84°F). Combined with high humidity during this period, the temperature can feel even warmer than the thermometer shows.
During the coldest month, July, the maximum average temperature is around 22°C (72°F). This period has moderate humidity. Check out our detailed temperature page for more information.
Pick a month to see the average temperature, rainfall and sunshine in Bargara - and find the best time to visit.
Temperature Rainfall Humidity
See the full Bargara climate overview or explore weather in Australia.
Where to go in October - average daytime high across popular destinations.
Noosa Heads 25°C (77°F) Brisbane
 26°C (79°F) Byron Bay24°C (75°F) Gold Coast
 24°C (75°F) Perth23°C (73°F) Sydney22°C (72°F) Adelaide20°C (68°F) Melbourne20°C (68°F)
 Need travel inspiration? Check out our bucket list articles and be inspired.
An alternative way to discover Sydney
We have made an overview of the sights in Sydney that you must see if you want to visit Sydney in an alternative way.
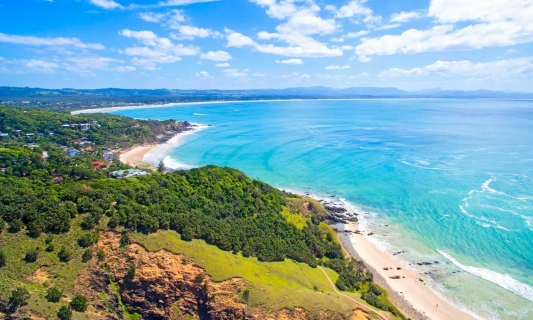 The most relaxed and alternative area of Australia is called the Byron Shire
The Byron Shire is one of the most pretty areas in the world. Not only in terms on natural beauty, also the relaxed vibe and people make this an area that remains close to your heart.
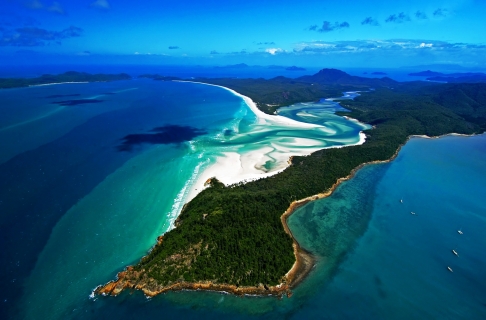 Sail the Whitsunday islands
The best travel period to sail the Whitsunday islands is “winter” between June and October, with pleasant temperatures around 23 degrees Celsius (74 Fahrenheit).
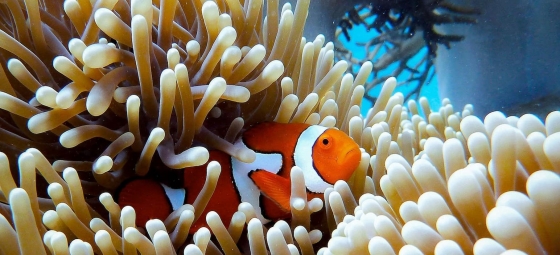 The best dive spots in Australia
Explore Australia's best dive spots: from the Great Barrier Reef to HMAS Perth. Discover vibrant corals, marine life, and historic wrecks.