


















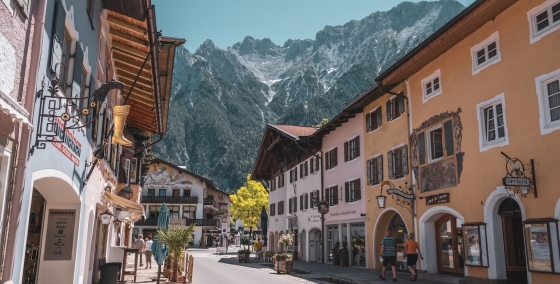
 The 10 most beautiful towns in Germany
Explore Germany's hidden gems with our guide to 10 stunning cities beyond Berlin. Discover historic towns, unique culture, and cozy atmospheres."
February in Rust brings low temperatures around 8°C (46°F) during the day, dropping to 0°C (32°F) at night, with quite a bit of rainfall expected, averaging around 76 mm (3 in) for the month.
If you prefer dry days with pleasant temperatures, February may not be the ideal month to visit Rust. Our weather planner can help you explore destinations with more pleasant weather conditions.
 Min Temperature
Max Temperature
Min Temperature
Max Temperature
 Chance of Rain
Precipitation
Rainy days
Chance of Rain
Precipitation
Rainy days
 Sunshine
Percentage Sunshine
Sunshine
Percentage Sunshine
Pick a month to see the average temperature, rainfall and sunshine in Rust - and find the best time to visit.
50-year average (1976-2025)
Based on our historical records, temperatures in Rust typically stay consistent throughout February, with daily highs averaging around 8°C (46°F). Nights are cold, with lows typically ranging from -2°C (28°F) to 2°C (36°F).
50-year average (1976-2025)
Average daily rainfall for each day of the month based on long-term records.
Browse day-by-day weather records for Rust spanning 51 years. Select any month and year to see actual temperatures, rainfall, and conditions recorded on each day.
Based on weather observations in Rust between 1976 and 2026, these are the recorded extremes during February.
Find out more about the weather in Germany and which places have the best travel conditions in this month. See all of Germany in February →
Perfect weather is subjective. On this map perfect weather has been defined with temperatures between 20°C (68°F) and 29°C (84°F) and not too much precipitation (less than 90 mm (3.5 in) a month).
We recommend to layer up for chilly conditions in Rust in February. You could start with thermal underwear or a good base layer to keep your core warm on the cooler days this month. Maybe also add a sweater or fleece, and top it off with a windproof jacket. Rain is likely on several days, so bring a good rain jacket. You can probably leave your sunglasses at home, because sunny days are pretty rare this month.
We rated the following activities from 1 (least suitable) to 10 (best) to do.


See the full Rust climate overview or explore weather in Germany.
Where to go in February - average daytime high across popular destinations.
Düsseldorf 8°C (46°F) Cologne8°C (46°F) Hanover6°C (43°F) Munich6°C (43°F) Hamburg6°C (43°F) Berlin6°C (43°F) Binz
 5°C (41°F) Winterberg4°C (39°F)
 Need travel inspiration? Check out our bucket list articles and be inspired.
The 10 most beautiful towns in Germany
Explore Germany's hidden gems with our guide to 10 stunning cities beyond Berlin. Discover historic towns, unique culture, and cozy atmospheres."
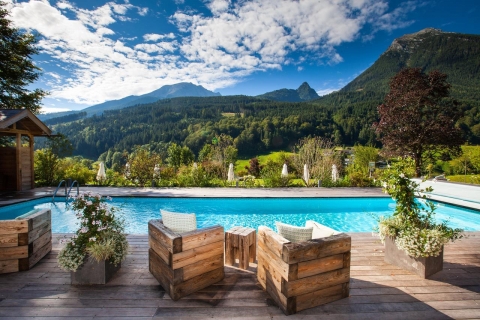 The dreamlike scenery of the German Alps
Nature in the most south-eastern part of Germany is impressive. The German Alps, with their diversity of landscapes, are an ideal destination for a wonderful holiday in nature.
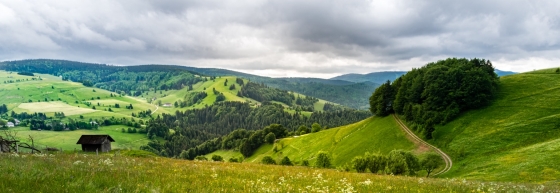 Discover Germany's Black Forest
Immerse yourself in nature and enjoy sustainable tourism practices in Germany's Black Forest. Hike, do yoga, and savor local organic cuisine and beer.

 Cycle the Danube trail
The Danube cycle route is one of the most popular cycling routes in Europe, and rightly so, because it is a varied route that is interesting both in terms of culture and nature.