August Rainfall and Precipitation in Chiloé Island
Chiloé Island Weather by Month
Pick a month to see the average temperature, rainfall and sunshine in Chiloé Island - and find the best time to visit. See also: Chiloé Island weather by month.


Best Places to Visit in Chiloé Island in August
Click on a destination dot for more details. Toggle the map to compare temperatures or precipitation across Chiloé Island.
Monthly precipitation
0 mm (0 in) dry → 150 mm (5.9 in) wet
Marker color shows total monthly precipitation in August: pale blue is dry, deep blue is wet.
Chiloé Island precipitation in August: frequently asked questions
How much rainfall does Chiloé Island, Chile receive in August?
August in Chiloé Island, Chile is a significant part of the rainy season. It might not be the best month for a trip. Castro often receives substantial rainfall, averaging approximately 218 mm (8.6 in). The frequent showers make the weather unpredictable, with conditions shifting rapidly.
How many days does it rain in Chiloé Island, Chile in August?
Rainfall in Castro typically falls on roughly 10 days days in August.
Is August part of the rainy season in Chiloé Island, Chile?
Yes. August falls within the rainy season in Chiloé Island, Chile. Expect more frequent showers and pack accordingly.
What is the wettest city in August in Chiloé Island, Chile?
In our database, Ancud stands out as having an average rainfall level of 250 mm (9.8 in), making it the wettest location.
What is the driest city in August in Chiloé Island, Chile?
Based on our database, Chonchi sees the least rainfall in Chiloé Island, Chile in August, with around 206 mm (8.1 in) on average.
Interested in more climate information?
We have much more information about the climate in Chiloé Island.
Weather and climate has detailed information for every country in the world. Are you going to Chile? Get detailed historical weather averages for many cities in Chile.
Not sure yet where to go? We now have a tool which recommends destinations that suit your ideal travel conditions. Find out where to go with our weather planner.
Bucket list
Need travel inspiration? Check out our bucket list articles and be inspired.

 The 10 most alternative cities in South America
Discover South America's top 10 alternative cities! From Valparaíso's vibrant streets to La Paz's high-altitude charm and Medellín's innovative spirit.

 Torres del Paine
Torres del Paine is an huge national park on the border with Argentina. It is possible to walk here along craters, high-rising mountain ridges, over glaciers and through vast majestic tundra.
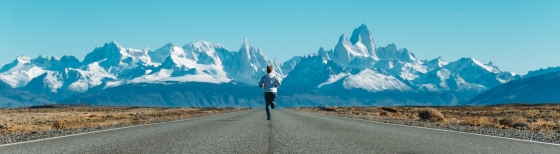 Explore Patagonia
A tour through Patagonia brings you to the end of the world. That’s why Patagonia is a bucket list destination for many. We recommend to visit Patagonia from November to early March.
 Enjoy the silence and peace in a spectacular landscape
This lodge guarantees privacy and exclusivity for those seeking to get away from mass tourism and enjoy the silence and peace in a spectacular landscape.