















 The 10 most alternative cities in South America
Discover South America's top 10 alternative cities! From Valparaíso's vibrant streets to La Paz's high-altitude charm and Medellín's innovative spirit.
October in Frutillar typically sees daytime highs of 16°C (61°F) and nighttime lows of 7°C (45°F). Rainfall is also possible this month, so it's worth packing an umbrella.
If you prefer enjoying temperate temperatures and rain-free days, January and February typically offer the best circumstances. If you're seeking pleasant, dry and sunny weather somewhere else in the world, our weather planner can help you explore other options.
 Min Temperature
Max Temperature
Min Temperature
Max Temperature
 Chance of Rain
Precipitation
Rainy days
Chance of Rain
Precipitation
Rainy days
 Humidity
 Sunshine
Percentage Sunshine
Sunshine
Percentage Sunshine
Pick a month to see the average temperature, rainfall and sunshine in Frutillar - and find the best time to visit.
50-year average (1976-2025)
Based on our historical records, temperatures in Frutillar typically stay consistent throughout October, with daily highs averaging around 16°C (61°F). Nights are cold, with lows typically ranging from 5°C (41°F) to 7°C (45°F).
50-year average (1976-2025)
Average daily rainfall for each day of the month based on long-term records.
Browse day-by-day weather records for Frutillar spanning 51 years. Select any month and year to see actual temperatures, rainfall, and conditions recorded on each day.
Our historical data for Frutillar spans 1976 to 2025, revealing these weather extremes.
Find out more about the weather in Chile and which places have the best travel conditions in this month. See all of Chile in October →
Perfect weather is subjective. On this map perfect weather has been defined with temperatures between 20°C (68°F) and 29°C (84°F) and not too much precipitation (less than 90 mm (3.5 in) a month).
The weather can swing between comfortable and chilly in October, so flexibility is key. Pack a variety of tops, at least one warm layer, and both shorts and long pants. This gives you options no matter what the day brings. Expect heavy rainfall, so bring good rain protection and waterproof bags. It won't hurt to bring your sunglasses along, as you'll see some sunny periods.
We rated the following activities from 1 (least suitable) to 10 (best) to do.


Temperature Rainfall Sunshine Humidity
See the full Frutillar climate overview or explore weather in Chile.
Where to go in October - average daytime high across popular destinations.
 San Pedro de Atacama
 23°C (73°F) Hanga Roa
 21°C (70°F) Santiago21°C (70°F) La Serena
 21°C (70°F) Viña del Mar17°C (63°F) Valparaíso16°C (61°F) Pucón
 15°C (59°F)
 Need travel inspiration? Check out our bucket list articles and be inspired.
The 10 most alternative cities in South America
Discover South America's top 10 alternative cities! From Valparaíso's vibrant streets to La Paz's high-altitude charm and Medellín's innovative spirit.
 Torres del Paine
Torres del Paine is an huge national park on the border with Argentina. It is possible to walk here along craters, high-rising mountain ridges, over glaciers and through vast majestic tundra.
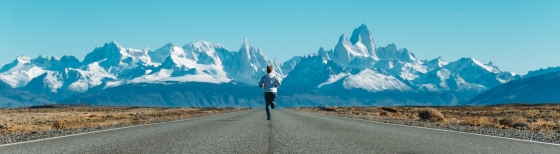 Explore Patagonia
A tour through Patagonia brings you to the end of the world. That’s why Patagonia is a bucket list destination for many. We recommend to visit Patagonia from November to early March.
 Enjoy the silence and peace in a spectacular landscape
This lodge guarantees privacy and exclusivity for those seeking to get away from mass tourism and enjoy the silence and peace in a spectacular landscape.