


















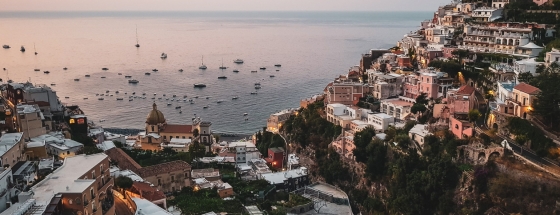
 The 10 most beautiful historical towns in Italy
Discover Italy's top 10 historic towns, featuring breathtaking medieval architecture and deep-rooted history, ideal for enthusiasts of extraordinary cities.
October in Barcis typically sees daytime highs of 15°C (59°F) and nighttime lows of 7°C (45°F). Rainfall is also possible this month, so it's worth packing an umbrella.
For Barcis itself, July, August and September generally stand out with the best circumstances. If you're seeking pleasant, dry and sunny weather somewhere else in the world, our weather planner can help you explore other options.
 Min Temperature
Max Temperature
Min Temperature
Max Temperature
 Chance of Rain
Precipitation
Rainy days
Chance of Rain
Precipitation
Rainy days
 Humidity
 Sunshine
Percentage Sunshine
Sunshine
Percentage Sunshine
Pick a month to see the average temperature, rainfall and sunshine in Barcis - and find the best time to visit.
Find out more about the weather in Italy and which places have the best travel conditions in this month. See all of Italy in October →
Perfect weather is subjective. On this map perfect weather has been defined with temperatures between 20°C (68°F) and 29°C (84°F) and not too much precipitation (less than 90 mm (3.5 in) a month).
Pack for changing conditions in Barcis in October. Bring a mix of short and long sleeves, a warm layer like a hoodie or light jacket, and comfortable pants. The key is being able to add or remove layers as the days goes by. Heavy rain is guaranteed, please bring a good poncho and waterproof everything! It won't hurt to bring your sunglasses along, as you'll see some sunny periods.
We rated the following activities from 1 (least suitable) to 10 (best) to do.


Temperature Rainfall Sunshine Humidity
See the full Barcis climate overview or explore weather in Italy.
Where to go in October - average daytime high across popular destinations.
Need travel inspiration? Check out our bucket list articles and be inspired.
The 10 most beautiful historical towns in Italy
Discover Italy's top 10 historic towns, featuring breathtaking medieval architecture and deep-rooted history, ideal for enthusiasts of extraordinary cities.
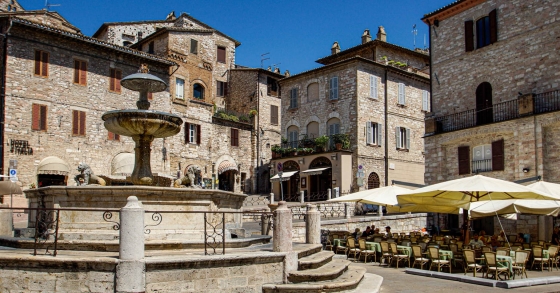 Experience mystical Assisi
Assisi is the most famous town in Umbria and best known because of Saints Francis and Clare of Assisi. Many visitors come to see the breathtaking San Francesco basilica.
 The Battle of Oranges
This is one of the most unusual festivals in Italy. The festival is held in the middle of winter during the winter carnival. The entire city of Ivrea near Turin turns into a battlefield.
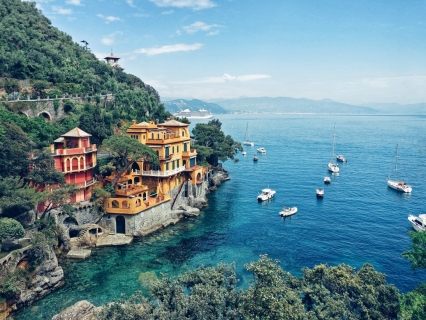 The most beautiful fishing village of Italy
Portofino is the most beautiful fishing village in Italy and maybe even in the world. We absolutely recommend that you add this beautiful place to your bucket list.