Weather in October in Puerto Rico
Planning a trip to Puerto Rico this October? Here's what you need to know about the weather:
What is the weather like in Puerto Rico in October?
October in Puerto Rico generally has very warm temperatures, with precipitation levels ranging from moderate to heavy.
Temperatures
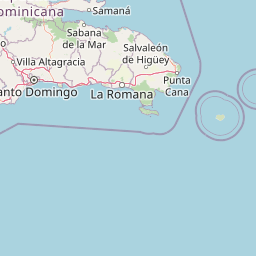
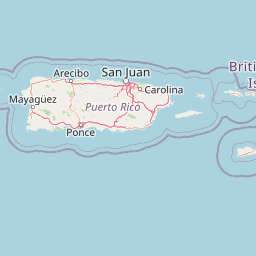
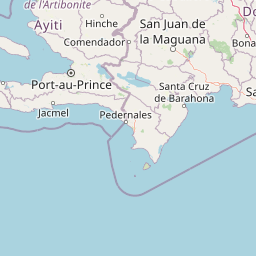
You can expect very warm maximum daytime temperatures of around 31°C and nighttime temperatures around 25°C in San Juan. The temperatures cited for both day and night represent usual averages, but it's possible some days could be hotter. It's advisable to dress accordingly to handle the heat.To explore the conditions in Puerto Rico in more detail, check the map below.
Precipitation
In October, precipitation varies across different areas. From moderate rainfall in Rincon with an average of 82 mm to heavy rainfall in Naguabo with 175 mm.Average sunshine
The days are mostly sunny, with an average total of around 228 hours of sunshine in San Juan. The sunlight during this month doesn't just make the days brighter, it also seems to make everyone a bit more cheerful.For more details on the yearly climate, visit our Puerto Rico climate page.
Where to go in Puerto Rico in October


 perfect weather
 pleasant
 tolerable
 unpleasant
 poor
poor
Select a Month of Interest
Check the conditions for any month of the year.
For a detailed overview over the year and the best time to visit Puerto Rico, check out our Puerto Rico's climate page.
Popular destinations
What is the weather like in October for the 5 most popular destinations in Puerto Rico?
San Juan
In October San Juan generally has very high temperatures with maximum daytime temperatures around 31°C, minimum nighttime temperatures around 25°C and high monthly rainfall. So on average the conditions are tolerable that month.
 Max temperature
Max temp
Min temperature
Min temp
Max temperature
Max temp
Min temperature
Min temp
Rincon
In October Rincon generally has high temperatures with maximum daytime temperatures around 30°C, minimum nighttime temperatures around 26°C and moderate monthly rainfall. So on average the conditions are pleasant that month.
Max temperature
Max temp
Min temperature
Min temp
Vieques
In October Vieques generally has high temperatures with maximum daytime temperatures around 29°C, minimum nighttime temperatures around 26°C and high monthly rainfall. So on average the conditions are pleasant that month.
Max temperature
Max temp
Min temperature
Min temp
Culebra
In October Culebra generally has high temperatures with maximum daytime temperatures around 29°C, minimum nighttime temperatures around 26°C and high monthly rainfall. So on average the conditions are pleasant that month.
Max temperature
Max temp
Min temperature
Min temp
Fajardo
In October Fajardo generally has high temperatures with maximum daytime temperatures around 30°C, minimum nighttime temperatures around 26°C and heavy monthly rainfall. So on average the conditions are tolerable that month.
Max temperature
Max temp
Min temperature
Min temp
Is your destination not in the list? Have a look at other destinations in Puerto Rico.
Is October the best time to visit Puerto Rico?
Given the typically tolerable weather conditions in San Juan, October may not be the ideal time to visit Puerto Rico.
Generally speaking, the best visiting conditions can be found in January, February, March and December offering mostly perfect weather in San Juan. The weather in May, July, August, September, October and November, on the other hand, tends to be tolerable.
Interested in more climate information?
We have much more information about the climate in Puerto Rico.
Weather and climate has detailed information for every country in the world. Are you going to Puerto Rico? Get detailed historical weather averages for many cities in Puerto Rico.
Not sure yet where to go? We now have a tool which recommends destinations that suit your ideal travel conditions. Find out where to go with our weather planner.