Climate ▸Forecast ▸March ▸April ▸
JanuaryFebruaryMarchAprilMayJuneJulyAugustSeptemberOctoberNovemberDecember

Average water temperature in Vestervig

On this page you find the mean water temperature over the year in Vestervig (Nordjylland), Denmark. Take a closer look at the water temperature patterns and what they mean for swimming and recreation.

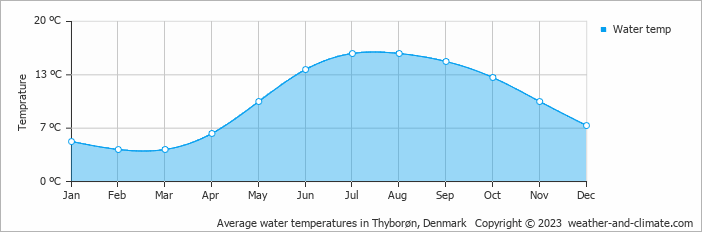
Data from: Thyborøn, Denmark (10 KM, 6 Miles).

In Vestervig, cooler water temperatures are a year-round feature. The warmest month is July, averaging 16°C.

The coldest month, March, sees averages of 4°C. This does not make it a great month for visitors who enjoy swimming.


Forecast for Vestervig

Tuesday
25 Mar
Light rain
Light rain
6°C
1.7 mm
Wednesday
26 Mar
Partly cloudy
Partly cloudy
9°C
0 mm
Thursday
27 Mar
Cloudy
Cloudy
7°C
0 mm

Interested in more climate information?

This site provides you with all the information you need about the climate in Vestervig.

Our site offers climate and forecast data for every country in the world. Are you going to Denmark? On this website you can find historical weather averages for many cities in Denmark. Not sure yet where to go? We now have a tool which recommends destinations that suit your ideal travel conditions. Find out where to go with our weather planner.

) ?>