ClimateForecastMayJune >>

Average water temperature in La Torraccia

The mean water temperature over the year in La Torraccia (Marche), Italy.

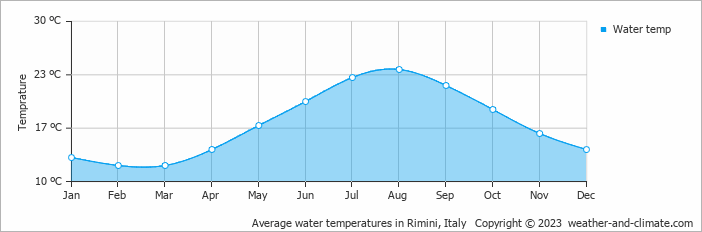
* Data from: Rimini, Italy (21 KM, 13 Miles).
  • The months June, July, August, September and October have a pleasant water temperature.
  • On average, August has the warmest water temperature with 24°C.
  • On average, March has the coldest water temperature with 12°C.

Weather Forecasts for La Torraccia

Fri   May 03
17°C | 9°C
W 14 km/h
partly cloudy and no rain

partly cloudy and no rain

Sat   May 04
19°C | 11°C
N 14 km/h
almost clear and no rain

almost clear and no rain

Sun   May 05
21°C | 12°C
SW 18 km/h
partly cloudy and no rain

partly cloudy and no rain

Interested in more climate information?

Weather and Climate provides you with all the information you need about the climate in La Torraccia.

Our site offers climate and forecast data for every country in the world. Are you going to Italy? On this website you can find historical weather averages for many cities in Italy. Not sure yet where to go? We now have a tool which recommends destinations that suit your ideal climate conditions. Find out where to go with our weather planner.

) ?>