La Torraccia Sunshine Hours by Month
Sunshine plays a big role in understanding the climate of a city. This page shows the total number of hours of direct sunlight per month and the average hours per day in La Torraccia, Le Marche, Italy. The numbers reflect climate data gathered over a 30-year period, from 1990 to 2020.
Monthly hours of sunshine
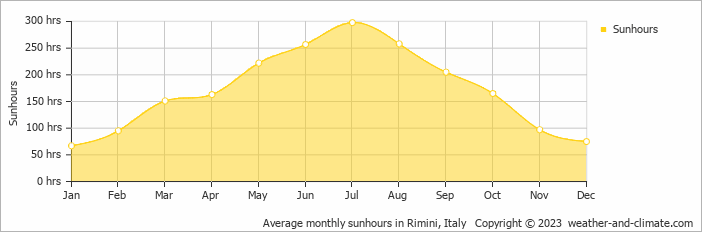
Seasonal sunshine in La Torraccia varies. It peaks at 298 hours in July and drops to 67 hours in January. The total annual amount of sun is 2053 hours.
Daily hours of sunshine
Seasonal changes in sunshine hours are quite obvious in La Torraccia. While July receives considerable daily sunshine with up to 9.9 hours, January marks the darkest time of the year, where sunshine is scarce with only 2.2 hours of sunlight per day.
Average percent of sunshine
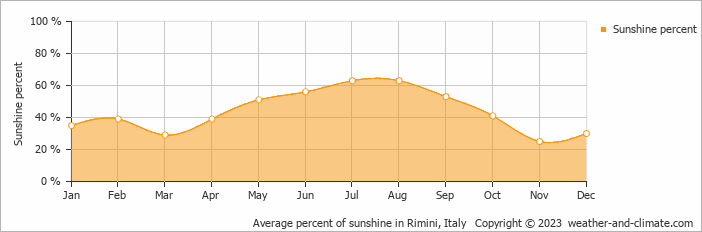
On average the sun shines 63% of the time during the day in August, the highest percentage of any month. November has the lowest percentage at 25%.
La Torraccia vs Major Cities: Sunshine Compared
La Torraccia enjoys an average of 2053 hours of sunshine annually. Let’s compare this with some popular tourist destinations:
In Lisbon, Portugal, there are approximately 2801 hours of sunshine annually, highlighting its warm and sunny Mediterranean climate.
In contrast, Reykjavík, Iceland, receives only about 1330 hours of sunshine per year, known for its frequently overcast and rainy skies.
Oslo, Norway, receives approximately 1690 hours of sunshine annually.
Perth, Australia, enjoys 3180 hours of sunshine annually, the highest among major Australian cities.
Related Climate Data for La Torraccia
November, La Torraccia’s wettest month, receives 34 mm (1.3 in) of rainfall and has a maximum daytime temperature of 16°C (61°F). During the driest month July you can expect a temperature of 28°C (82°F).
For more detailed insights into the city’s temperatures, check out our Temperature page. To explore more about precipitation patterns, visit our La Torraccia Precipitation page.


