Vrbov Monthly Rainfall & Precipitation
This page shows both the average monthly rainfall and the number of rainy days in Vrbov, Prešovský kraj, Slovakia. These values are calculated using 30 years of data (1990–2020) to ensure accuracy. Now, let's explore all the details to give you a full picture.
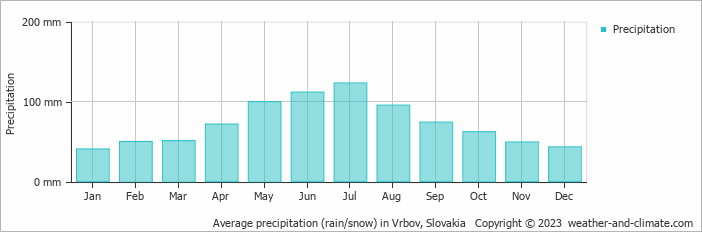
Generally, Vrbov experiences moderate precipitation patterns, averaging 871 mm (34 in) yearly.
Monthly Precipitation Levels
The average number of days each month with precipitation (> 0.2 mm (0.01 in))
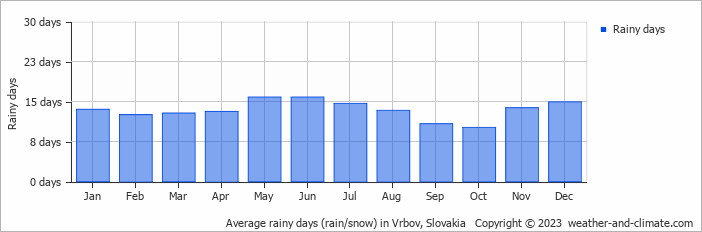
Significant seasonal changes in precipitation occur throughout the year. During the wettest month, July receives substantial rainfall, averaging 123 mm (4.8 in) of precipitation, recorded across 15 rainy days.
In contrast, the driest month, January brings less snowfall, with 41 mm (1.6 in) over 14 snowy days.
July, the wettest month, has a maximum daytime temperature of 23°C (73°F). The city receives 221 hours of sunshine in this period. During the driest month January you can expect a temperature of 1°C (34°F). For more detailed insights into the city's temperatures, visit our Vrbov Temperature page.
Annual Rainfall in Slovakia: City Comparison
The map below shows the annual precipitation across Slovakia. You can also select the different months in case you are interested in a specific month.
 heavy rainfall
 high
high
 moderate
 low
low
 almost none
Vrbov vs World: Rainfall Compared
Vrbov's average annual precipitation is 871 mm (34 in). Let's compare this to some popular worldwide tourist destinations:
In Toronto, Canada, annual precipitation averages 964 mm (38 in), with snowy winters and rainy summers.
In Seoul, South Korea, the average annual precipitation is 1237 mm (49 in), with most rain falling during the summer monsoon season.
In Brisbane, Australia, the annual precipitation is 979 mm (39 in), making it wetter than Sydney.
Ho Chi Minh City, Vietnam, receives 1955 mm (77 in) of annual rainfall, with a pronounced wet season from May to November, typical of its tropical monsoon climate.
Precipitation amounts are measured using specific gauges installed at weather stations, collecting both rain and snow and any other type of precipitation. Rainfall is measured directly in millimeters, while that from snow and ice is obtained by melting it. Automated systems often incorporate heaters to make this easier.
Information from these stations is transmitted via Wi-Fi, satellite, GPS, or telephone connections to central monitoring networks. This information is immediately updated and integrated into weather models and forecasts.
- "Ginger" was the longest-lasting Atlantic tropical storm, which spun around the open ocean for 28 days in 1971.
- The world's largest snowflake was recorded in the Guinness Book of Records, at 38 cm (15 inches) wide and 20 cm (7.9 inches) thick. The snowflake fell at Fort Keogh, Montana, USA, on 28 January 1887.
- The greatest snowfall recorded was on Mt. Rainier, Washington State, USA—over 31.5 meters (103 feet) fell during the winter of 1972.
For more detailed information about Vrbov's weather, including sunshine hours, humidity levels, and temperature data, visit our Vrbov Climate page.


