Orosí Monthly Rainfall & Precipitation
This page shows both the average monthly rainfall and the number of rainy days in Orosí, Cartago, Costa Rica. These averages rely on historical data collected over 30 years, from 1990 to 2020. Now, let's explore all the details to give you a full picture.
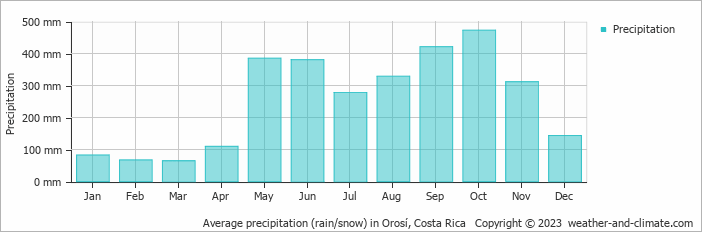
Orosí has a relatively rainy climate with high precipitation levels, averaging 3041 mm (120 in) of rainfall annually. Despite the high annual total, it does experience a distinct rainy season during certain months. Examine our detailed charts below to understand these seasonal patterns.
Monthly Precipitation Levels
The average number of days each month with precipitation (> 0.2 mm (0.01 in))
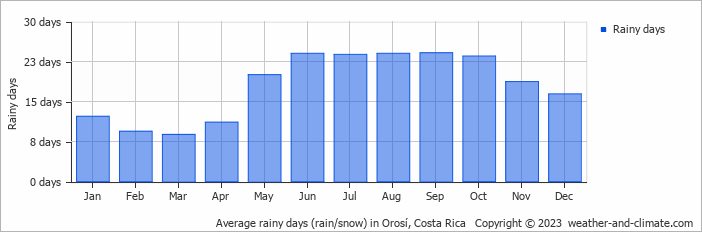
Orosí can be quite wet during October, receiving approximately 472 mm (19 in) of precipitation over 24 rainy days.
In contrast March, experiences much drier conditions, with 64 mm (2.5 in) of rainfall, spread across 9 rainy days.
October, the wettest month, has a maximum daytime temperature of 23°C (73°F). The city receives 162 hours of sunshine in this period. During the driest month March you can expect a temperature of 23°C (73°F). For more detailed insights into the city's temperatures, visit our Orosí Temperature page.
Annual Rainfall in Costa Rica: City Comparison
The map below shows the annual precipitation across Costa Rica. You can also select the different months in case you are interested in a specific month.
 heavy rainfall
 high
high
 moderate
 low
low
 almost none
Orosí vs World: Rainfall Compared
Orosí's average annual precipitation is 3041 mm (120 in). Let's compare this to some popular worldwide tourist destinations:
The city of Rome, Italy, has an average annual precipitation of 832 mm (33 in), spread fairly evenly throughout the year.
Osaka, Japan, experiences 1507 mm (59 in) of rainfall annually, spread across the year with wetter summers.
Melbourne, Australia, has 690 mm (27 in) of rainfall annually, spread fairly evenly throughout the year.
Ho Chi Minh City, Vietnam, receives 1955 mm (77 in) of annual rainfall, with a pronounced wet season from May to November, typical of its tropical monsoon climate.
Precipitation amounts are measured using specific gauges installed at weather stations, collecting both rain and snow and any other type of precipitation. Rainfall is measured directly in millimeters, while that from snow and ice is obtained by melting it. Automated systems often incorporate heaters to make this easier.
Information from these stations is transmitted via Wi-Fi, satellite, GPS, or telephone connections to central monitoring networks. This information is immediately updated and integrated into weather models and forecasts.
- The U.S. has a significant number of thunderstorms every year, with over 14.6 million taking place across the world annually.
- Approximately 70% of lightning bolts strike land rather than oceans.
- A storm named John was the longest-lasting Pacific tropical storm, continuing for 31 days. As it crossed the dateline twice, it changed status from a hurricane to a typhoon and back to a hurricane.
For more detailed information about Orosí's weather, including sunshine hours, humidity levels, and temperature data, visit our Orosí Climate page.