














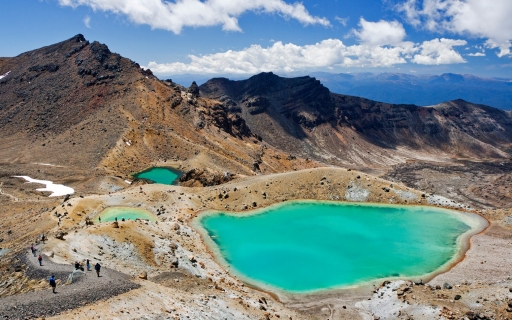
 The Tongariro Crossing in New Zealand
It is called the most beautiful walk in New Zealand, the Tongariro Crossing. The official hiking season starts late October until end of April.
This page shows both the average monthly rainfall and the number of rainy days in Kaiteriteri, Tasman, New Zealand. The numbers reflect climate data gathered over a 30-year period, from 1990 to 2020. Now, let's explore all the details to give you a full picture.
Kaiteriteri has a notably wet climate with abundant precipitation, recording 1552 mm (61 in) of rainfall per year.
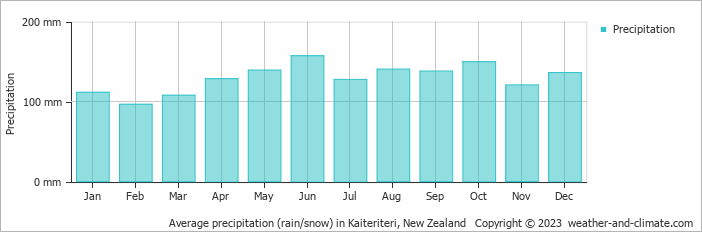
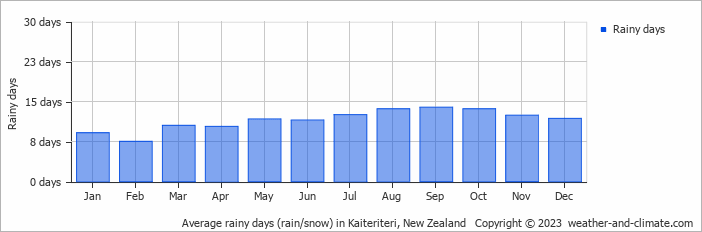
The wettest period in Kaiteriteri occurs in June, which receives around 157 mm (6.2 in) of precipitation. During the driest month, February, Kaiteriteri experiences moderate rainfall, totaling approximately 96 mm (3.8 in). The consistent precipitation levels throughout the year contribute to a relatively stable climate.
June, the wettest month, has a maximum daytime temperature of 13°C (55°F). The city receives 150 hours of sunshine in this period. During the driest month February you can expect a temperature of 21°C (70°F). For more detailed insights into the city's temperatures, visit our Kaiteriteri Temperature page.
The map below shows the annual precipitation across New Zealand. You can also select the different months in case you are interested in a specific month.
Kaiteriteri's average annual precipitation is 1552 mm (61 in). Let's compare this to some popular worldwide tourist destinations:
Seville, Spain, experiences 541 mm (21 in) of rainfall annually, with wet winters and dry summers typical of southern Spain.
Osaka, Japan, experiences 1507 mm (59 in) of rainfall annually, spread across the year with wetter summers.
Perth, Australia, receives 565 mm (22 in) of rainfall annually, mostly during the winter months.
Singapore, situated near the equator, gets 2581 mm (102 in) of rainfall annually, with no distinct dry season and consistent monthly precipitation.
Precipitation amounts are measured using specific gauges installed at weather stations, collecting both rain and snow and any other type of precipitation. Rainfall is measured directly in millimeters, while that from snow and ice is obtained by melting it. Automated systems often incorporate heaters to make this easier.
Information from these stations is transmitted via Wi-Fi, satellite, GPS, or telephone connections to central monitoring networks. This information is immediately updated and integrated into weather models and forecasts.
For more detailed information about Kaiteriteri's weather, including sunshine hours, humidity levels, and temperature data, visit our Kaiteriteri Climate page.
Pick a month to see the average temperature, rainfall and sunshine in Kaiteriteri - and find the best time to visit.
Temperature Rainfall Sunshine
See the full Kaiteriteri climate overview or explore weather in New Zealand.
Where to go in October - average daytime high across popular destinations.
Paihia 18°C (64°F) Auckland
 18°C (64°F) Rotorua
 17°C (63°F) Christchurch17°C (63°F) Nelson
 16°C (61°F) Taupo16°C (61°F) Wellington15°C (59°F) Queenstown
 9°C (48°F)
 Need travel inspiration? Check out our bucket list articles and be inspired.
The Tongariro Crossing in New Zealand
It is called the most beautiful walk in New Zealand, the Tongariro Crossing. The official hiking season starts late October until end of April.
 White-water sledge and raft in Rotorua
We recommend to white-water sledge and raft in Rotorua in summer (January, February) when the Glacier melt fills the rivers. This is the best time.
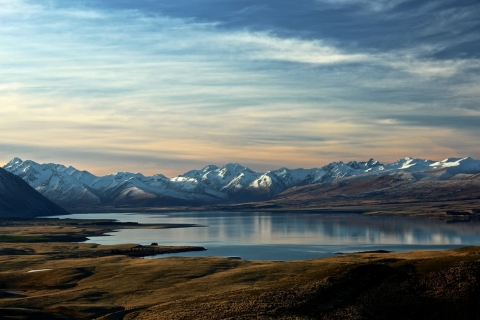 New Zealand in February: North Island or South Island?
Compare New Zealand weather in February for Auckland, Rotorua, Taupo, Christchurch and Queenstown to see which island has the best conditions.

 An alternative way to discover Sydney
We have made an overview of the sights in Sydney that you must see if you want to visit Sydney in an alternative way.