
















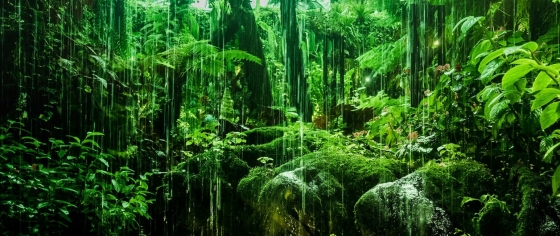
 The top 5 unexplored rainforests in Central America
Dive into Central America's top 5 hidden rainforests for an unparalleled journey through vibrant wildlife and diverse landscapes.
This page shows both the average monthly rainfall and the number of rainy days in Juayúa, Cerro Verde National Park, El Salvador. These values are calculated using 30 years of data (1990–2020) to ensure accuracy. Now, let's explore all the details to give you a full picture.
Juayúa experiences significant rainfall throughout the year, averaging 1920 mm (76 in) of precipitation annually. However, this abundant rainfall is not evenly distributed, with a distinct dry and rainy season during certain months. You can clearly see this in our monthly precipitation graphs below.


Juayúa can be quite wet during September, receiving approximately 386 mm (15 in) of precipitation over 29 rainy days.
In contrast January, experiences much drier conditions, with 5.7 mm (0.2 in) of rainfall, spread across 4 rainy days.
September, the wettest month, has a maximum daytime temperature of 29°C (84°F). The city receives 202 hours of sunshine in this period. During the driest month January you can expect a temperature of 30°C (86°F). For more detailed insights into the city's temperatures, visit our Juayúa Temperature page.
The map below shows the annual precipitation across El Salvador. You can also select the different months in case you are interested in a specific month.
Juayúa's average annual precipitation is 1920 mm (76 in). Let's compare this to some popular worldwide tourist destinations:
New York City, USA, receives 1276 mm (50 in) of rainfall annually, with precipitation evenly distributed throughout the year.
Beijing, China, receives 560 mm (22 in) of annual precipitation, concentrated in the summer months.
Adelaide, Australia, enjoys 511 mm (20 in) of annual precipitation, with dry summers and wet winters.
Ho Chi Minh City, Vietnam, receives 1955 mm (77 in) of annual rainfall, with a pronounced wet season from May to November, typical of its tropical monsoon climate.
Precipitation amounts are measured using specific gauges installed at weather stations, collecting both rain and snow and any other type of precipitation. Rainfall is measured directly in millimeters, while that from snow and ice is obtained by melting it. Automated systems often incorporate heaters to make this easier.
Information from these stations is transmitted via Wi-Fi, satellite, GPS, or telephone connections to central monitoring networks. This information is immediately updated and integrated into weather models and forecasts.
Precipitation has a very strong role in determining the local climate and ecosystem:
For more detailed information about Juayúa's weather, including sunshine hours, humidity levels, and temperature data, visit our Juayúa Climate page.
Pick a month to see the average temperature, rainfall and sunshine in Juayúa - and find the best time to visit.
Temperature Rainfall Sunshine Humidity
See the full Juayúa climate overview or explore weather in El Salvador.
Where to go in October - average daytime high across popular destinations.
 San Miguel
 32°C (90°F) San Salvador31°C (88°F) El Cuco30°C (86°F) Santa Ana30°C (86°F) El Zonte30°C (86°F) Concepción de Ataco29°C (84°F) La Libertad29°C (84°F) El Sunzal29°C (84°F)
Need travel inspiration? Check out our bucket list articles and be inspired.
The top 5 unexplored rainforests in Central America
Dive into Central America's top 5 hidden rainforests for an unparalleled journey through vibrant wildlife and diverse landscapes.
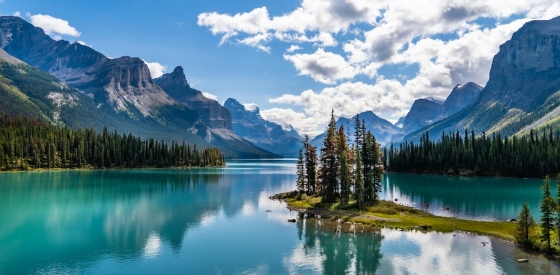
 The 5 most beautiful lakes in Canada
Explore Canada's stunning lakes: Lake Louise, Lake Superior, Maligne Lake, Emerald Lake, and Lake Okanagan, each offering unique beauty and activities.
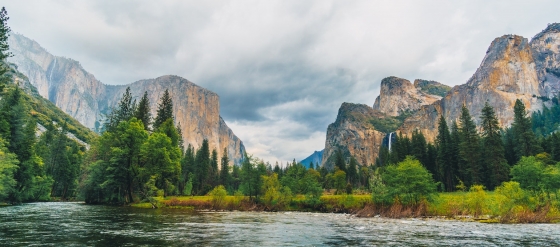
 Yosemite National Park is definitely worth a visit
Vast forests, blue lakes, towering sequoias, and majestic waterfalls hint at the beauty of Yosemite National Park—a true natural masterpiece.
 The 10 most alternative cities in the United States
Discover the top 10 fun and alternative U.S. cities rich in art, culture, and adventure. From Portland's hippy charm to Sedona's stunning landscapes.