Houlakia Monthly Rainfall & Precipitation
This page shows both the average monthly rainfall and the number of rainy days in Houlakia, Cyclades, Greece. The numbers reflect climate data gathered over a 30-year period, from 1990 to 2020. Now, let's explore all the details to give you a full picture.
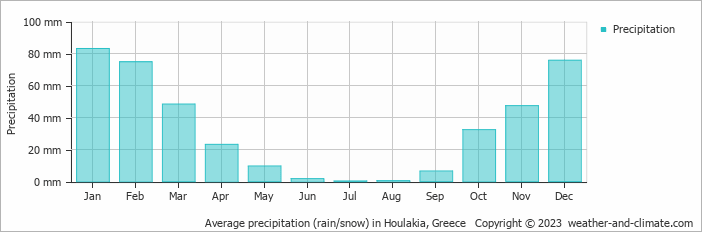
Houlakia maintains relatively dry conditions year-round, with an average annual precipitation of 403 mm (16 in). However, it does have a distinct dry season during certain months, creating distinct seasonal patterns visible in our monthly breakdown below.
Monthly Rainfall & Rainy Days
Monthly Precipitation Levels
The average number of days each month with precipitation (> 0.2 mm (0.01 in))
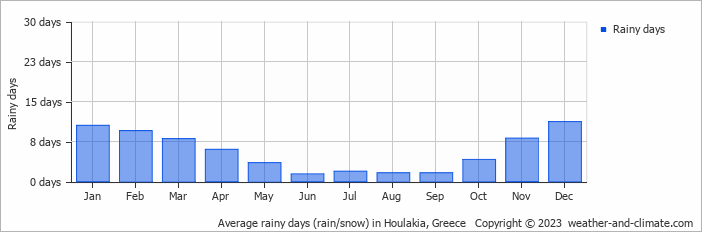
The climate in Houlakia shows significant variation throughout the year. Expect 83 mm (3.3 in) of precipitation during the wettest month January, distributed over 11 rainy days.
In contrast, July offers drier and sunnier days, with around 0.3 mm (0.01 in) of rainfall over 2 rainy days.
January, the wettest month, has a maximum daytime temperature of 15°C (59°F). During the driest month July you can expect a temperature of 26°C (79°F). For more detailed insights into the city's temperatures, visit our Houlakia Temperature page.
Annual Rainfall in Greece: City Comparison
The map below shows the annual precipitation across Greece. You can also select the different months in case you are interested in a specific month.
Houlakia vs World: Rainfall Compared
Houlakia's average annual precipitation is 403 mm (16 in). Let's compare this to some popular worldwide tourist destinations:
The city of Rome, Italy, has an average annual precipitation of 832 mm (33 in), spread fairly evenly throughout the year.
In Seoul, South Korea, the average annual precipitation is 1237 mm (49 in), with most rain falling during the summer monsoon season.
Perth, Australia, receives 565 mm (22 in) of rainfall annually, mostly during the winter months.
Ho Chi Minh City, Vietnam, receives 1955 mm (77 in) of annual rainfall, with a pronounced wet season from May to November, typical of its tropical monsoon climate.
Precipitation amounts are measured using specific gauges installed at weather stations, collecting both rain and snow and any other type of precipitation. Rainfall is measured directly in millimeters, while that from snow and ice is obtained by melting it. Automated systems often incorporate heaters to make this easier.
Information from these stations is transmitted via Wi-Fi, satellite, GPS, or telephone connections to central monitoring networks. This information is immediately updated and integrated into weather models and forecasts.
The proximity of a location to a large body of water can significantly affect its rainfall patterns:
- Ocean Influence: Coastal regions typically receive more rainfall due to the presence of moisture-laden winds from the ocean. These regions tend to have more humid climates and experience more frequent precipitation, especially in winter.
- Continental Climates: Areas further from the sea, such as inland or continental regions, experience less frequent rainfall and more extreme seasonal variations in precipitation.
- Mawsynram in India is noted as being the wettest place on earth, with over 11 meters (36 feet) of rain falling every year.
- In contrast, Antofagasta in Chile is among the driest places on the planet, getting less than 0.1mm (0.004 inches) per year, with some years recording virtually no rainfall.
- Nearly 1,650 thunderstorm cells are estimated over the planet at any given time.
For more detailed information about Houlakia's weather, including sunshine hours, humidity levels, and temperature data, visit our Houlakia Climate page.
Houlakia Weather by Month
Pick a month to see the average temperature, rainfall and sunshine in Houlakia - and find the best time to visit.
Houlakia 3-Day Forecast
Temperature Rainfall Humidity
See the full Houlakia climate overview or explore weather in Greece.
Popular this month
Where to go in July - average daytime high across popular destinations.
Bucket list
Need travel inspiration? Check out our bucket list articles and be inspired.
 Top 5 secluded beaches in Greece
Explore Greece's hidden gems: secluded beaches like Fokos, Seychelles, Potami, Kedrodasos, and Mouros for tranquil adventures away from crowds.
Discover Zakynthos
On the Greek island you can discover the rugged coastline, authentic old villages, a beautiful interior and the caves with the beautiful azure water.
Why Santorini should be on every Bucket List
This Greek island is home to some of the most stunning scenery globally, with its beautiful Caldera views, white-washed houses and crystal-clear waters.