Hergiswil Monthly Rainfall & Precipitation
This page shows both the average monthly rainfall and the number of rainy days in Hergiswil, Canton of Lucerne, Switzerland. These values are calculated using 30 years of data (1990–2020) to ensure accuracy. Let's explore the details to provide you with a complete overview.
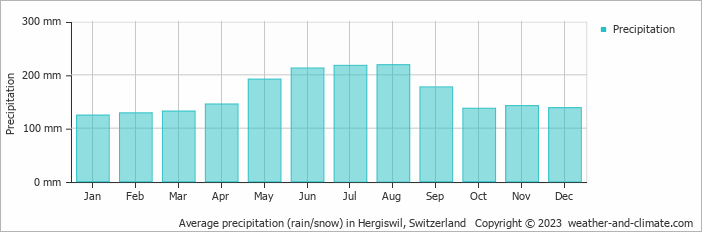
Hergiswil has a relatively rain/snowy climate with high precipitation levels, averaging 1963 mm (77 in) of rain/snowfall annually. Despite the high annual total, it does experience a distinct rainy season during certain months. Examine our detailed charts below to understand these seasonal patterns.
Monthly Precipitation Levels
The average number of days each month with precipitation (> 0.2 mm (0.01 in))
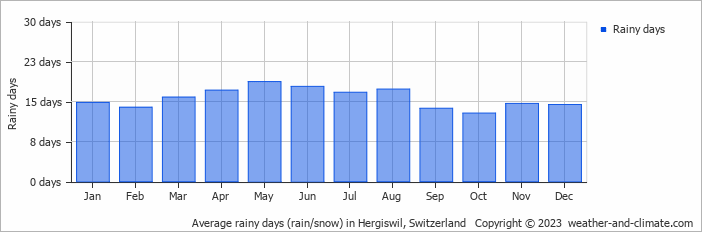
While rainfall varies throughout the year, each season offers its own charm. August brings wetter days averaging 219 mm (8.6 in) of precipitation, spread over 17 rainy days.
In contrast, January experiences a drier climate, with about 124 mm (4.9 in) of snow/rainfall spread across 15 snowy/rainy days.
August, the wettest month, has a maximum daytime temperature of 22°C (72°F). The city receives 158 hours of sunshine in this period. During the driest month January you can expect a temperature of 3°C (37°F). For more detailed insights into the city's temperatures, visit our Hergiswil Temperature page.
Annual Rainfall in Switzerland: City Comparison
The map below shows the annual precipitation across Switzerland. You can also select the different months in case you are interested in a specific month.
 heavy rainfall
 high
high
 moderate
 low
low
 almost none
Hergiswil vs World: Rainfall Compared
Hergiswil's average annual precipitation is 1963 mm (77 in). Let's compare this to some popular worldwide tourist destinations:
Boston, USA, experiences 1238 mm (49 in) of annual precipitation, including significant snowfall during the winter.
Osaka, Japan, experiences 1507 mm (59 in) of rainfall annually, spread across the year with wetter summers.
In Tokyo, Japan, the average annual precipitation is 1528 mm (60 in), with significant summer rains due to typhoon season.
Mumbai, India, experiences a tropical monsoon climate with 1860 mm (73 in) of annual rainfall, with the majority of precipitation happening during the monsoon season from June to September.
Precipitation amounts are measured using specific gauges installed at weather stations, collecting both rain and snow and any other type of precipitation. Rainfall is measured directly in millimeters, while that from snow and ice is obtained by melting it. Automated systems often incorporate heaters to make this easier.
Information from these stations is transmitted via Wi-Fi, satellite, GPS, or telephone connections to central monitoring networks. This information is immediately updated and integrated into weather models and forecasts.
Precipitation has a very strong role in determining the local climate and ecosystem:
- Changing Rainfall Patterns: Global warming causes drastic changes in the patterns of rainfall. Some areas have been experiencing increased frequency and intensity of rainfall, while other areas experience longer dry spells or even droughts.
- Local Impacts: Many regions are experiencing heavier rainfall in the winter months and drier, hotter summers. This affects agriculture, water resources, and ecosystems.
- The U.S. has a significant number of thunderstorms every year, with over 14.6 million taking place across the world annually.
- Approximately 70% of lightning bolts strike land rather than oceans.
- A storm named John was the longest-lasting Pacific tropical storm, continuing for 31 days. As it crossed the dateline twice, it changed status from a hurricane to a typhoon and back to a hurricane.
For more detailed information about Hergiswil's weather, including sunshine hours, humidity levels, and temperature data, visit our Hergiswil Climate page.