Haraki Monthly Rainfall & Precipitation
This page shows both the average monthly rainfall and the number of rainy days in Haraki, Dodecanese, Greece. Long-term data from 1990 to 2020 was used to calculate these averages. Now, let's break down all the details for a clearer picture.
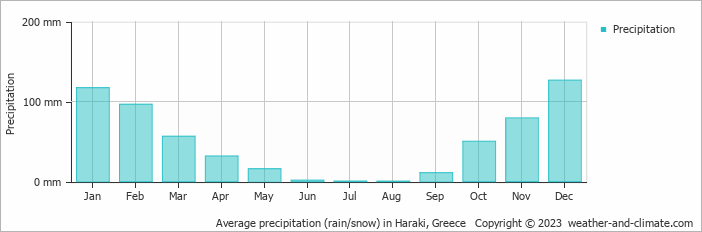
On average, Haraki receives a reasonable amount of rainfall, with an annual precipitation of 586 mm (23 in). Despite this overall moderate level, the city experiences distinct dry season during certain months throughout the year, as illustrated in the precipitation charts below.
Monthly Rainfall & Rainy Days
Monthly Precipitation Levels
The average number of days each month with precipitation (> 0.2 mm (0.01 in))
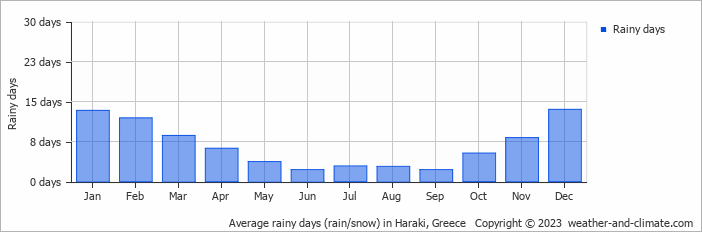
Significant seasonal changes in precipitation occur throughout the year. During the wettest month, December receives substantial rainfall, averaging 127 mm (5 in) of precipitation, recorded across 14 rainy days.
In contrast, the driest month, August brings less rainfall, with 0.3 mm (0.01 in) over 3 rainy days.
December, the wettest month, has a maximum daytime temperature of 18°C (64°F). The city receives 108 hours of sunshine in this period. During the driest month August you can expect a temperature of 30°C (86°F). For more detailed insights into the city's temperatures, visit our Haraki Temperature page.
Annual Rainfall in Greece: City Comparison
The map below shows the annual precipitation across Greece. You can also select the different months in case you are interested in a specific month.
Haraki vs World: Rainfall Compared
Haraki's average annual precipitation is 586 mm (23 in). Let's compare this to some popular worldwide tourist destinations:
The climate in San Francisco, USA, is influenced by coastal weather, with 469 mm (18 in) of rainfall mostly during the winter months.
Osaka, Japan, experiences 1507 mm (59 in) of rainfall annually, spread across the year with wetter summers.
In Tokyo, Japan, the average annual precipitation is 1528 mm (60 in), with significant summer rains due to typhoon season.
Ho Chi Minh City, Vietnam, receives 1955 mm (77 in) of annual rainfall, with a pronounced wet season from May to November, typical of its tropical monsoon climate.
Precipitation amounts are measured using specific gauges installed at weather stations, collecting both rain and snow and any other type of precipitation. Rainfall is measured directly in millimeters, while that from snow and ice is obtained by melting it. Automated systems often incorporate heaters to make this easier.
Information from these stations is transmitted via Wi-Fi, satellite, GPS, or telephone connections to central monitoring networks. This information is immediately updated and integrated into weather models and forecasts.
Tropical Rainforests: In tropical regions, rainfall is generally abundant year-round. Areas near the equator, like the Amazon rainforest, can receive up to 3000 mm (118 in) of rain annually.
Desert Regions: Deserts such as the Sahara and Arabian deserts typically see less than 250 mm (9.8 in) of rainfall annually. Rainfall tends to be infrequent, but when it does occur, it is often intense.
Temperate Zones: In temperate regions, precipitation tends to be more evenly distributed, though areas closer to the ocean may see more rain in the winter months, and areas further inland experience drier summers.
Polar Regions: Precipitation in polar regions, like Antarctica, is extremely low, often falling as snow. Average annual precipitation in Antarctica is less than 200 mm (7.9 in), with some areas receiving as little as 50 mm (2 in) annually.
- Mawsynram in India is noted as being the wettest place on earth, with over 11 meters (36 feet) of rain falling every year.
- In contrast, Antofagasta in Chile is among the driest places on the planet, getting less than 0.1mm (0.004 inches) per year, with some years recording virtually no rainfall.
- Nearly 1,650 thunderstorm cells are estimated over the planet at any given time.
For more detailed information about Haraki's weather, including sunshine hours, humidity levels, and temperature data, visit our Haraki Climate page.
Haraki Weather by Month
Pick a month to see the average temperature, rainfall and sunshine in Haraki - and find the best time to visit.
Haraki 3-Day Forecast
Temperature Rainfall Sunshine Humidity Wind Speed Water Temp
See the full Haraki climate overview or explore weather in Greece.
Popular this month
Where to go in July - average daytime high across popular destinations.
Bucket list
Need travel inspiration? Check out our bucket list articles and be inspired.
 Top 5 secluded beaches in Greece
Explore Greece's hidden gems: secluded beaches like Fokos, Seychelles, Potami, Kedrodasos, and Mouros for tranquil adventures away from crowds.
Discover Zakynthos
On the Greek island you can discover the rugged coastline, authentic old villages, a beautiful interior and the caves with the beautiful azure water.
Why Santorini should be on every Bucket List
This Greek island is home to some of the most stunning scenery globally, with its beautiful Caldera views, white-washed houses and crystal-clear waters.